

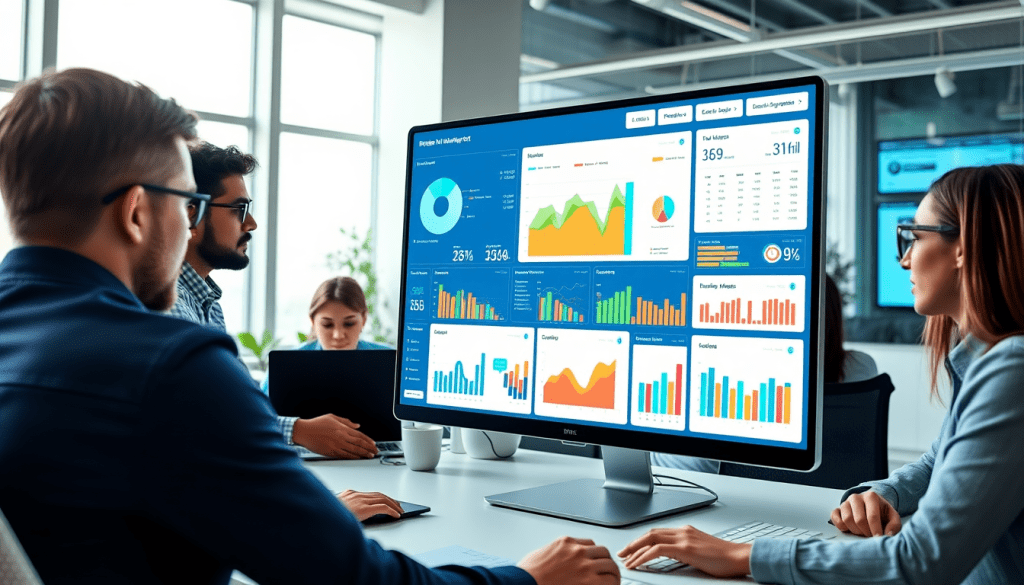
Digital Marketing KPI Dashboard: Visualize Metrics Instantly
A digital marketing KPI dashboard puts all your essential campaign data in one place, transforming how teams track, analyze, and act on marketing performance. Instead of juggling countless spreadsheets and disconnected tools, marketers can use these dashboards to monitor KPIs in real time, uncover actionable insights, and make confident decisions faster. With features like automated reporting, AI-powered analytics, and interactive visualizations, a well-designed KPI dashboard helps brands, agencies, and marketing teams focus on what drives real results—across every channel.
What Is a Digital Marketing KPI Dashboard?
A digital marketing KPI dashboard is your command center for campaign performance—bringing together all your essential metrics in one interactive, always-updating view.
Why Use a Digital Marketing KPI Dashboard?
Here’s what sets these dashboards apart:
- Unified Data: See paid search, social, email, display, and more in a single dashboard—no more scattered spreadsheets.
- Real-Time Insights: Get up-to-the-minute snapshots of marketing performance and ROI, without waiting for manual reports.
- Instant Clarity: Visualize complex data in easy-to-understand charts, graphs, and tables.
Who Benefits from a KPI Dashboard?
-
Agencies:
- Streamline client reporting across hundreds of campaigns.
- Deliver professional, branded updates with less manual work.
-
In-House Marketing Teams:
- Access critical KPIs at a glance.
- Make faster, data-driven decisions.
-
Multi-Channel Marketers:
- Compare performance across platforms side-by-side.
- Quickly spot what’s working—and what needs a pivot.
Key Advantages at a Glance
| Feature | Benefit |
|---|---|
| Automated Data Collection | No more manual gathering or copy-paste chaos |
| Centralized Visualization | All metrics, all channels, one dashboard |
| Actionable Intelligence | AI-powered insights highlight what matters |
| Transparency | Stakeholders see the same trusted numbers |
| Productivity Boost | Save hours each week—focus on strategy, not reporting |
How Does Dashboard Automation Help?
Instead of spending hours building reports, marketers get dashboards that:
- Update automatically as new data comes in.
- Highlight trends and anomalies with built-in intelligence.
- Enable quick sharing with stakeholders and clients.
Want to learn more about automating dashboard workflows? Check out our guide on dashboard automation benefits.
With a digital marketing KPI dashboard, you spend less time chasing data and more time driving results.
Essential Marketing Metrics to Track
Choosing the right KPIs is the backbone of effective digital marketing measurement. While every business has unique objectives, several core metrics provide universal value for campaign tracking, ROI analysis, and decision-making.
1. Impressions:
Impressions measure how often your content or ad is displayed, regardless of clicks. This metric is crucial for assessing brand visibility and the potential reach of your campaigns. High impressions signal broad awareness, but they must be paired with engagement metrics to assess true impact.
2. Click-Through Rate (CTR):
CTR is the percentage of viewers who click on your ad or content out of the total impressions. It’s a direct indicator of how compelling your messaging and creative are. A healthy CTR shows your audience finds your offer relevant, making this metric essential for both paid and organic campaigns.
3. Cost Per Acquisition (CPA):
CPA reveals how much you spend, on average, to acquire a customer or lead. Tracking CPA helps marketers optimize ad spend and allocate budget toward the most efficient channels. Lower CPA generally translates to better campaign profitability.
4. Return on Ad Spend (ROAS):
ROAS measures the revenue generated for every dollar spent on advertising. It’s a critical KPI for evaluating the effectiveness of your campaigns and justifying budget increases or reallocations. High ROAS means your campaigns are delivering meaningful returns.
5. Conversions:
Conversions count the number of times users complete a desired action—such as filling out a form, making a purchase, or downloading a resource. Tracking conversions provides direct insight into campaign effectiveness and business impact.
Why These Metrics Matter:
Each of these KPIs contributes a different perspective to your marketing performance. Impressions and CTR reveal the top-of-funnel awareness and engagement, while CPA, ROAS, and conversions measure efficiency and bottom-line impact. Monitoring these metrics together allows marketers to balance reach, engagement, and ROI for holistic campaign optimization.
Best Practices for Selecting Relevant KPIs:
- Align KPIs with Objectives: Always map your chosen metrics to your specific business and campaign goals. For example, prioritize conversions and CPA for lead generation, or impressions and CTR for brand awareness.
- Avoid Vanity Metrics: Focus on KPIs that tie directly to outcomes you can influence, rather than surface-level stats.
- Regularly Reassess Metrics: As your campaigns evolve, revisit your KPI selection to ensure continued relevance.
- Centralize and Automate: Use a robust dashboard platform, such as TapClicks, to bring all your KPIs together, automate updates, and easily share insights with stakeholders.
By tracking the right mix of metrics, your digital marketing KPI dashboard becomes a powerful tool for driving growth, accountability, and smarter decision-making.
What Makes a Great Performance Tracking Dashboard?
Choosing the right marketing KPI dashboard isn’t just about visual appeal—it’s about giving your team the power to act on data, not just look at it. Here’s what to prioritize so your dashboard becomes a strategic advantage:
See Everything, All in One Place
Cross-Channel Analytics
- Integrate data from search, social, display, email, and more
- View your entire marketing mix in a single, unified dashboard
- Spot trends and attribution opportunities missed by isolated channel reports
Tip: Platforms like TapClicks offer 10,000+ data connectors for effortless integration across platforms.
Automate the Busywork
Automated KPI Reports
- Schedule, generate, and distribute reports automatically
- Eliminate manual reporting and free up analyst hours
- Ensure stakeholders always have the latest insights, effortlessly
Who benefits most?
- Agencies juggling hundreds of clients
- Brands with dozens of simultaneous campaigns
Make Data Make Sense
Data Visualization & Interactivity
- Dynamic graphs, charts, and scorecards turn numbers into stories
- Interactive filters and drill-downs let users explore without IT or analyst help
- Customizable views for instant, on-demand insights
Get Smart, Not Just Informed
AI-Powered Insights
- Built-in AI agents analyze your dashboards and metrics automatically
- Surface hidden trends, performance anomalies, and optimization opportunities
- Move from “what happened?” to “what should we do next?”
Give the Right People the Right Data
User Access & Customization
| Feature | Why It Matters |
|---|---|
| Granular User Access | Tailor dashboards for clients, execs, or ops |
| White-Label Branding | Essential for agencies managing clients |
| Custom Widgets & Layouts | Enterprise teams can match unique workflows |
Your Dashboard: More Than a Pretty Report
Don’t settle for dashboards that just display data. The best marketing KPI dashboards:
- Reveal what matters
- Recommend next steps
- Adapt to your team’s unique needs
Prioritize these features, and your dashboard will become the strategic hub that powers smarter, faster marketing decisions.
Benefits of Automated KPI Reports and AI Marketing Dashboards
Automated KPI reports and AI-driven marketing dashboards have revolutionized how marketers manage, analyze, and present campaign data. By removing the manual labor of data collection and report creation, automation dramatically reduces the risk of human error and ensures that reporting is accurate, timely, and consistent across every reporting cycle. This not only frees up analysts and account managers to focus on strategy and optimization but also accelerates the delivery of insights to stakeholders—often transforming what was once a days-long process into a matter of minutes.
AI-powered dashboards take this efficiency even further. Rather than simply displaying numbers, modern dashboards leverage artificial intelligence to surface actionable insights and optimization recommendations. For example, AI agents can automatically flag underperforming campaigns, suggest budget reallocations, or identify shifts in audience behavior before they impact ROI. This proactive intelligence empowers marketing teams to react swiftly, make data-driven decisions, and continuously improve campaign outcomes.
The combination of automation and AI ensures that every stakeholder—from agency executives to brand managers—receives tailored, up-to-date reports without the need for repetitive manual work. This means less time spent wrangling spreadsheets and more time acting on the insights that drive results. To learn more about how analytics reporting automation can boost consistency and uncover deeper insights, check out this overview of marketing dashboard automation for analytics reporting.
In short, automated and AI-driven dashboards not only streamline the reporting process, but also unlock a new level of marketing intelligence—helping teams achieve better outcomes, faster.
Cross-Channel Analytics: Unifying Data for Better Decisions
Today’s marketing landscape is fragmented across countless platforms—social media, search engines, display networks, email, and more. Without cross-channel analytics, valuable insights get trapped in silos, making it difficult to see the big picture. A robust cross-channel analytics dashboard brings all your marketing data together, providing a unified view of performance across every channel and touchpoint.
By consolidating data from disparate sources, cross-channel dashboards allow marketers to track the entire customer journey—from first impression to final conversion—within a single interface. This holistic visibility helps teams pinpoint which campaigns are driving engagement, how different channels interact, and where optimizations will have the greatest impact. Instead of toggling between Facebook Ads Manager, Google Analytics, and email reports, you can instantly compare metrics side by side, uncover attribution paths, and spot trends that would otherwise go unnoticed.
The power of unified analytics doesn’t stop at visualization. Leading platforms like TapClicks offer deep integration capabilities, connecting seamlessly with over 10,000 marketing, advertising, CRM, and finance systems. This makes it easy to blend media performance with sales data, enrich reporting with offline conversions, or push cleaned marketing data directly to your organization’s BI tools. For agencies and large brands, this means less manual wrangling and more time spent on strategic analysis.
Ultimately, cross-channel analytics dashboards empower marketers to make smarter, data-driven decisions. With all your KPIs in one place and the ability to customize views for stakeholders across sales, ops, and leadership teams, you create a single source of truth that accelerates reporting, collaboration, and results.
Real-Time and Interactive Visualization: Your Campaign Control Center
In digital marketing, speed and clarity are everything. Real-time dashboards have become the backbone of modern campaign monitoring—eliminating guesswork and empowering you to act on insights the moment they matter.
Why Real-Time Dashboards Matter
- Instant Visibility: No more waiting for weekly reports or manual data pulls. Key metrics update automatically, so you can spot trends and issues as they arise.
- Immediate Action: Detect anomalies or underperforming segments and pivot your strategy on the fly—before small issues become big problems.
- Continuous Optimization: Quickly iterate creative, adjust bids, or reallocate budget based on what’s working now, not last week.
The Power of Interactivity
Real-time data is just the start. Modern dashboards go further by putting control in your hands:
- Filter by What Matters: Instantly slice results by:
- Channel (search, social, display, etc.)
- Campaign or creative
- Geography
- Audience segment
- Timeframe
- Drill Down for Details: Move from high-level KPIs to granular, campaign-level performance with a click.
- Side-by-Side Comparisons: Benchmark different campaigns, audiences, or geos to uncover what’s driving results.
- Custom Views for Every User: Build and save dashboards tailored to executives, account managers, or clients—reducing clutter and focusing on relevant insights.
Making Data Accessible to Everyone
Interactive dashboards do more than just visualize data—they make it accessible:
- Democratize Insights: Non-technical stakeholders can explore data visually, ask better questions, and participate in decision-making.
- Streamline Collaboration: For agencies or multi-location brands, role-based access and customizable views mean everyone sees the info they need—without risking data overload.
See it in action:
Unlocking real-time marketing data collection shows how automated data feeds supercharge your dashboards.
What Can You Track in Real Time?
Here are just a few examples of what’s possible with real-time, interactive dashboards:
| Metric Type | Example Insights |
|---|---|
| Social Engagement | Live reactions, shares, comments |
| Paid Search ROI | Up-to-the-minute cost and conversions |
| Multi-Channel Funnels | See how channels work together |
| Budget Pacing | Track spend vs. goals daily |
| Creative Performance | A/B test results as they unfold |
With TapClicks, your dashboards become a command center—transforming raw marketing data into actionable intelligence, exactly when and where you need it.
How to Set Up and Optimize Your Marketing KPI Dashboard
Building an effective marketing KPI dashboard doesn’t have to be overwhelming—with a clear process, you can accelerate time-to-insight and ensure your reporting actually drives results. Here’s a step-by-step outline to help you set up a dashboard that delivers real value from day one:
1. Centralize Your Data Sources
Start by integrating all relevant marketing platforms and data sources—think ad networks, web analytics, CRM systems, email platforms, and social channels. The key is to ensure your dashboard pulls clean, up-to-date data automatically. Consider using a unified marketing operations platform like TapClicks to streamline connections and eliminate manual data wrangling.
2. Define and Select Key Metrics
Identify the KPIs that matter most to your business goals and stakeholders. Rather than tracking every available metric, focus on those that align directly with campaign objectives—such as conversions, cost per acquisition (CPA), return on ad spend (ROAS), or engagement rates. Involve stakeholders early to ensure their priorities are reflected and to drive buy-in.
3. Design Intuitive Visualizations
Translate raw data into clear, actionable visuals. Use charts, graphs, and tables that highlight trends, variances, and opportunities at a glance. Group related metrics together (e.g., awareness, consideration, conversion) and enable filtering by channel, campaign, or audience segment. The goal: make it easy for users to find answers and spot insights.
4. Automate Reporting and Alerts
Set up automated report generation and scheduling so teams and clients receive timely updates—without manual effort. Leverage dashboard tools that offer AI-powered recommendations and anomaly detection, helping you spot issues or optimization opportunities faster.
5. Enable Collaboration and Custom Views
Empower different teams or stakeholders with tailored dashboard views and role-based access controls. This ensures everyone—from executives to channel managers—can see the information most relevant to them, while maintaining data security and integrity.
6. Review, Refine, and Realign Regularly
Dashboards aren’t “set it and forget it.” Schedule regular reviews to assess if your dashboard design still matches evolving business goals, campaign strategies, or stakeholder needs. Solicit feedback, update metrics as priorities shift, and incorporate new data sources or AI features as they become available.
By following these steps and fostering ongoing collaboration, your marketing KPI dashboard will remain a high-impact tool—delivering insights, improving decisions, and driving better results for your team and organization.
Conclusion
In today’s fast-paced digital landscape, a centralized, automated KPI dashboard is no longer a luxury—it’s a necessity for marketing success. By unifying data sources, automating repetitive reporting, and surfacing actionable insights through AI, these dashboards empower teams to make smarter, faster decisions. Instead of sifting through scattered spreadsheets or wrestling with manual updates, marketers can visualize performance across every channel in real time, focus on high-impact metrics, and swiftly pivot campaigns for maximum ROI.
If your current reporting setup leaves you juggling tools or struggling to find timely answers, now is the time to rethink your approach. An AI-powered, interactive KPI dashboard isn’t just about efficiency—it’s about giving your team the clarity and confidence to drive better results, campaign after campaign. Explore how a platform like TapClicks can help you unlock the full potential of your marketing data and turn insight into action.
Start Automating Your Marketing Data Today!
No Credit Card Required.

