

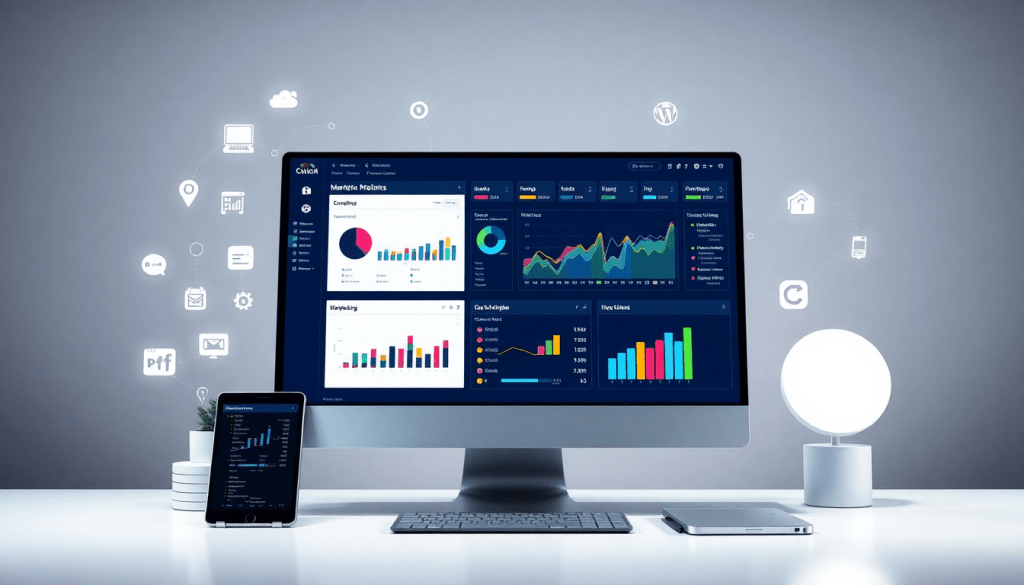
Digital Marketing KPI Dashboard: Visualize Campaign Metrics Fast
A digital marketing KPI dashboard transforms scattered campaign data into clear, actionable insights. With the right dashboard, marketers can visualize performance trends, monitor KPIs in real time, and automate reporting—eliminating manual work and guesswork. Whether you’re managing multi-channel campaigns or need a single source of truth for ROI, an advanced dashboard centralizes your metrics and amplifies the impact of your strategy. This guide explores how to choose, build, and leverage a digital marketing KPI dashboard for better, faster marketing decisions.
What is a Digital Marketing KPI Dashboard?
A digital marketing KPI dashboard is a centralized, visual workspace designed to track, measure, and analyze the key performance indicators (KPIs) that drive marketing success. At its core, this dashboard pulls together data from multiple marketing channels—think paid search, social media, email, and more—transforming complex metrics into clear, actionable visualizations. Marketers rely on these dashboards to monitor campaign health in real time, quickly spot trends or anomalies, and make smarter, data-driven decisions without the hassle of compiling endless spreadsheets.
The primary purpose of a digital marketing KPI dashboard is to provide instant visibility into the metrics that matter most for your campaigns. Instead of juggling disconnected reports or logging into multiple platforms, you get a single source of truth that highlights performance against your goals. Whether you’re tracking impressions, conversions, or return on ad spend (ROAS), a well-designed dashboard lets you slice and dice the data—by channel, time period, creative, or audience segment—so you can pinpoint what’s working and what needs adjustment.
It’s important to distinguish between a basic dashboard and a comprehensive campaign KPI monitoring solution. Basic dashboards might offer static charts or simple tables, often limited to one channel or data source. In contrast, a robust solution like TapClicks delivers automated data integration, real-time updates, cross-channel comparisons, and customizable reporting. This means you’re not just visualizing data, but actively using it to optimize campaigns, allocate budgets, and demonstrate ROI—at scale.
For a deeper dive into the fundamentals, see What is a Digital Marketing KPI Dashboard?.
Core Metrics Every Marketing Dashboard Should Track
At the heart of any effective digital marketing KPI dashboard lies the careful selection and visualization of the right metrics. Tracking the most impactful KPIs enables marketers to quickly assess campaign health, identify optimization opportunities, and demonstrate ROI to stakeholders. Here are the essential metrics every marketing dashboard should feature:
1. Impressions
Impressions measure how often your ads or content are displayed to users. This top-of-funnel metric is crucial for understanding reach and brand visibility across platforms. High impression counts signal broad exposure, but they should always be considered alongside engagement and conversion metrics.
2. Clicks and Click-Through Rate (CTR)
Clicks indicate the number of times users interact with your ads or links, while CTR (clicks divided by impressions) reveals how compelling your creative and messaging are. Monitoring these together helps marketers pinpoint which channels and creatives drive the most interest.
3. Conversions and Conversion Rate
Conversions are the actions you want users to take—such as purchases, sign-ups, or downloads. Conversion rate (conversions divided by clicks or visits) is a direct indicator of campaign effectiveness and landing page performance.
4. Cost Per Acquisition (CPA)
CPA tracks how much you spend to acquire a new customer or lead. Keeping CPA within target thresholds ensures marketing efficiency and sustainable growth.
5. Return on Ad Spend (ROAS)
ROAS measures the revenue generated for every dollar spent on advertising. This bottom-line metric is essential for evaluating the profitability of campaigns and justifying budget allocations.
6. Engagement Metrics (Likes, Shares, Comments, Video Views)
Especially important for social media campaigns, engagement metrics provide insight into audience interaction and content resonance. Strong engagement often signals higher brand affinity and organic reach potential.
The Power of Cross-Channel Analytics
Today’s marketing landscape is fragmented across dozens of platforms—Google, Facebook, display, programmatic, email, and more. A cross-channel analytics dashboard consolidates all your data, enabling a holistic view of performance. By unifying metrics from different sources, marketers can identify attribution paths, allocate budgets more effectively, and eliminate blind spots.
Best Practices for Metric Prioritization
Not every metric matters equally for every campaign. To maximize dashboard relevance:
- Align KPIs with specific campaign objectives (e.g., awareness vs. direct response).
- Limit dashboards to actionable metrics that drive decision-making.
- Regularly review and adjust tracked KPIs as goals or strategies evolve.
For a deeper dive into how to visualize and track these metrics effectively, see Visualize and Track Metrics.
By focusing on these core KPIs and leveraging cross-channel analytics, marketers ensure their dashboards are both comprehensive and actionable—laying the groundwork for smarter, data-driven marketing decisions. For more on building unified, scalable dashboards, visit TapClicks.
Benefits of Automated KPI Reports and Interactive Dashboards
Automated KPI reports and interactive dashboards are game-changers for modern marketing teams, delivering efficiency and sharper insights at every turn. By eliminating the need for manual data pulls and spreadsheet wrangling, automated reporting saves hours each week—freeing up analysts and account managers to focus on strategy and optimization, not just data entry. This automation also reduces the risk of human error, ensuring your performance reports are always accurate and up-to-date.
Interactivity takes dashboards a step further. With features like filters, drill-downs, and dynamic views, users can explore campaign metrics at both a high level and granular detail. Want to see conversion trends by channel, region, or creative? Simply adjust the dashboard filter, and the visualizations update instantly. This empowers marketers to answer client questions on the fly, uncover performance drivers, and spot anomalies before they impact results.
Another key advantage is the ability to schedule reports and set up automated alerts. Instead of scrambling to compile weekly or monthly updates, teams can configure dashboards to deliver branded, client-ready reports straight to stakeholders’ inboxes—on any cadence they choose. Automated alerts can flag sudden changes in KPIs, so you’re notified immediately if a campaign dips below target or a budget is pacing off track.
Platforms like TapClicks take these workflows to the next level. For example, TapClicks users can build custom dashboards for each client or brand, set up scheduled reporting, and leverage interactive widgets for deep-dive analysis—all from a centralized hub. This not only boosts productivity but enhances client satisfaction by delivering timely, transparent, and actionable insights with every report.
In short, automated KPI reports and interactive dashboards streamline operations, elevate data accuracy, and empower marketing teams to make faster, smarter decisions—turning raw metrics into a strategic advantage.
Cross-Channel Analytics: Bringing All Your Marketing Data Together
Today’s digital marketing landscape is more fragmented than ever. With campaigns spanning Google Ads, Facebook, Instagram, programmatic platforms, and email, each channel produces its own set of metrics—locked away in separate dashboards. This creates major challenges for marketers:
- Blind Spots: Hard to see the big picture, making optimization tricky
- Manual Reporting: Endless copying and pasting into spreadsheets
- Delayed Insights: Slow analysis means missed opportunities
- Risk of Error: Manual aggregation increases mistakes
Why Unified Dashboards Are a Game Changer
A cross-channel analytics dashboard breaks down these silos by aggregating all your marketing metrics into a single, easy-to-understand view. Here’s what that unlocks:
All Your KPIs, Side by Side
| Channel | Impressions | Clicks | Conversions | CPA | ROAS |
|---|---|---|---|---|---|
| Google Ads | 120,000 | 2,400 | 150 | $22.50 | 4.1x |
| 90,000 | 1,100 | 80 | $28.75 | 3.2x | |
| 60,000 | 850 | 60 | $18.00 | 5.0x | |
| Programmatic | 50,000 | 700 | 40 | $35.00 | 2.8x |
- One View: Instantly spot which channels are delivering the best value
- Faster Attribution: See how each touchpoint contributes to conversions
- Smarter Budgeting: Confidently reallocate spend based on what’s working
What You Gain with Unified Analytics
- Accurate ROI Tracking: No more guesswork—attribute value to every channel
- Compelling Client/Stakeholder Reports: Tell a holistic story in less time
- Data-Driven Decisions: Quickly pivot strategies with up-to-date insights
- Efficiency: Automate what used to take hours (or days) in spreadsheets
Turn Data Into Action
Ready to see the difference?
- Explore an in-depth guide on visualizing metrics and tracking ROI
- Check out TapClicks: Effortlessly integrate, normalize, and analyze your marketing data—at any scale
With TapClicks, you can finally move from fragmented metrics to actionable, unified intelligence—so your team can focus on what matters: driving growth and proving value.
How AI-Powered Dashboards Deliver Smarter Marketing Insights
The next evolution in marketing analytics is here: AI-powered dashboards are transforming how marketers interpret and act on campaign data. Traditional dashboards excel at aggregating and visualizing KPIs, but even the most insightful charts require human analysis to spot hidden trends or diagnose performance shifts. Enter AI marketing dashboards—tools that don’t just display data but actively analyze it, surfacing real-time insights, anomalies, and optimization opportunities that might otherwise go unnoticed.
AI brings several advantages to marketing KPI dashboards. First, it automates the process of trend detection, quickly highlighting which channels or campaigns are outperforming or lagging behind expectations. For example, AI agents can sift through thousands of data points to pinpoint sudden spikes in cost per acquisition (CPA) or uncover underutilized budget segments. This means marketers can move from reactive reporting to proactive decision-making—spotting issues before they escalate and capitalizing on opportunities as soon as they arise.
An AI-powered dashboard also delivers actionable recommendations. Instead of simply noting that a campaign’s click-through rate (CTR) has dipped, an AI agent might suggest reallocating spend to higher-performing channels or tweaking creative assets for better engagement. TapClicks’ own AI capabilities, including TapInsights and SmartPilot, illustrate this advantage: the platform’s AI agents automatically analyze dashboards, generate insight summaries, and provide predictive recommendations for campaign optimization. Features like SmartEmail even deliver these insights directly to stakeholders’ inboxes, ensuring that critical information never gets lost in the noise.
Ultimately, integrating AI into your marketing dashboard means smarter, faster, and more effective campaign management. By surfacing patterns, diagnosing anomalies, and recommending next steps, AI-powered dashboards like those from TapClicks give marketers the edge they need to maximize ROI and stay ahead in an ever-changing digital landscape.
How to Choose a Marketing Dashboard That Actually Works for Your Team
Picking the right marketing KPI dashboard isn’t just a tech decision—it shapes how your team works, collaborates, and drives results every day. Let’s break down what to look for so you get a dashboard that grows with you, not against you.
What Truly Matters in a Modern Marketing Dashboard
1. Effortless Data Integration
- Connect to all major marketing, advertising, and business platforms—think Google Ads, Meta, programmatic, and beyond.
- Say goodbye to manual data imports and error-prone spreadsheets.
- Look for:
- Automated data pulls
- An extensive library of pre-built connectors (the more, the better—thousands is ideal)
- Easy setup, no IT ticket required
2. Flexible Reporting and Visualization
- Every team’s KPIs are unique—your dashboard should flex to fit.
- Features to demand:
- Drag-and-drop editors for building custom reports
- Branded templates for client-facing dashboards
- Interactive elements like dynamic filters, drill-downs, and real-time updates
3. Built-In Collaboration and Access Control
- Whether you’re agency-side with hundreds of clients or a brand managing multiple locations, control is key.
- Must-haves:
- Role-based access down to the metric or campaign level
- Secure sharing with clients, execs, and team members
- Streamlined collaboration without sacrificing privacy
4. Designed for Scale
- Your dashboard should never be the bottleneck.
- Look for:
- Support for thousands of dashboards, reports, and users
- Automated workflows and bulk reporting capabilities
- Centralized management (especially for multi-client or multi-location teams)
DIY Dashboards vs. Unified Platforms
| Aspect | DIY BI/Spreadsheets | Unified Platforms (e.g., TapClicks) |
|---|---|---|
| Data Integration | Manual, error-prone | Automated, thousands of connectors |
| Maintenance | High (ongoing troubleshooting) | Low (managed updates, support) |
| Scaling | Challenging | Built-in for high volume and complexity |
| Insights & Automation | Minimal | AI-powered insights, automated scheduling |
| Time to Value | Slow (custom setup) | Fast (out-of-the-box templates & reports) |
Quick Questions to Vet Any Dashboard
- Does it automate data integration from all my marketing sources?
- Can I fully customize reports and dashboards—for clients, execs, or my team?
- Is role-based access easy to manage and secure?
- Will it scale as my campaigns and client base grow?
- Does it offer workflow automation and AI-driven insights?
- How fast can I onboard my team and start seeing value?
Final Thought
Choose a dashboard that empowers your team to visualize, analyze, and act on data—without getting bogged down in manual work or data silos. Unified platforms like TapClicks deliver the scale, automation, and insights you need to focus on what matters: driving results.
Launching a KPI Dashboard? Here’s How to Make It Effortless
Rolling out a digital marketing KPI dashboard shouldn’t feel overwhelming. With the right approach, you can create a powerful, customized dashboard that delivers real value—fast.
Step 1: Bring All Your Data Sources Together
- Connect your marketing platforms:
Link Google Ads, Facebook, LinkedIn, programmatic tools, SEO platforms, and more. - Leverage pre-built connectors:
Platforms like TapClicks offer thousands of connectors for easy integration. - Automate your data pipeline:
Pull in campaign data automatically for real-time, cross-channel visibility.
Pro tip: Automating data integration is the single biggest timesaver for marketing teams—no more manual spreadsheet wrangling!
Step 2: Shape Your Dashboard with Widgets
- Choose your KPIs:
Impressions, clicks, conversions, CPA, ROAS, and beyond. - Drag-and-drop interface:
Arrange charts, graphs, and tables to spotlight what matters most. - Experiment with visuals:
Try out different formats to surface trends and highlight outliers.
| Sample KPI Widget | Best For |
|---|---|
| Line Chart | Trend analysis over time |
| Pie Chart | Budget or channel breakdowns |
| Scorecard | Quick-glance health metrics |
| Table | Detailed performance comparison |
Step 3: Automate Reporting & Stay Alert
- Automated reports:
Schedule weekly/monthly KPI recaps for clients and teams. - Real-time alerts:
Configure notifications for metric spikes or dips. - Reduce manual work:
Keep everyone informed without chasing spreadsheets.
Step 4: Tailor Views to Your Stakeholders
- Executive overviews:
High-level ROI, budget pacing, and trends. - Channel specialist views:
Granular performance details by source or campaign. - Role-based access:
Use TapClicks to customize who sees what.
Step 5: Start Smart, Then Improve
- Pick a proven template:
Use a best-practice dashboard as your starting point. - Gather feedback:
Ask users what’s working—and what’s missing. - Iterate:
Refine KPIs, tweak visuals, and adjust reporting cadence as your needs evolve.
Ready for Action
By following this roadmap, you’ll move from messy spreadsheets to a streamlined, actionable KPI dashboard—empowering your team to make faster, smarter campaign decisions. And with TapClicks, scaling your dashboard for multiple clients, brands, or locations is just a few clicks away.
Conclusion: Elevate Your Marketing Strategy with KPI Visualization
In today’s fast-paced marketing landscape, having a digital marketing KPI dashboard isn’t just a nice-to-have—it’s essential for staying ahead of the competition. By centralizing and visualizing your most important campaign metrics, dashboards empower your team to track performance, spot trends, and make smarter decisions in real time. Automated reporting, AI-driven insights, and interactive analytics not only save countless hours but also ensure your strategy is grounded in actionable data, not guesswork.
Ready to unlock the full potential of your marketing data? Explore how leading platforms like TapClicks can help you unify analytics, automate reporting, and deliver powerful insights at scale. For more expert advice and inspiration, check out our resources on building high-impact KPI dashboards and optimizing your analytics workflow.
Don’t let your marketing data sit in silos or spreadsheets. Take the next step—visualize your KPIs, streamline your reporting, and elevate your marketing strategy today.
Start Automating Your Marketing Data Today!
No Credit Card Required.

