

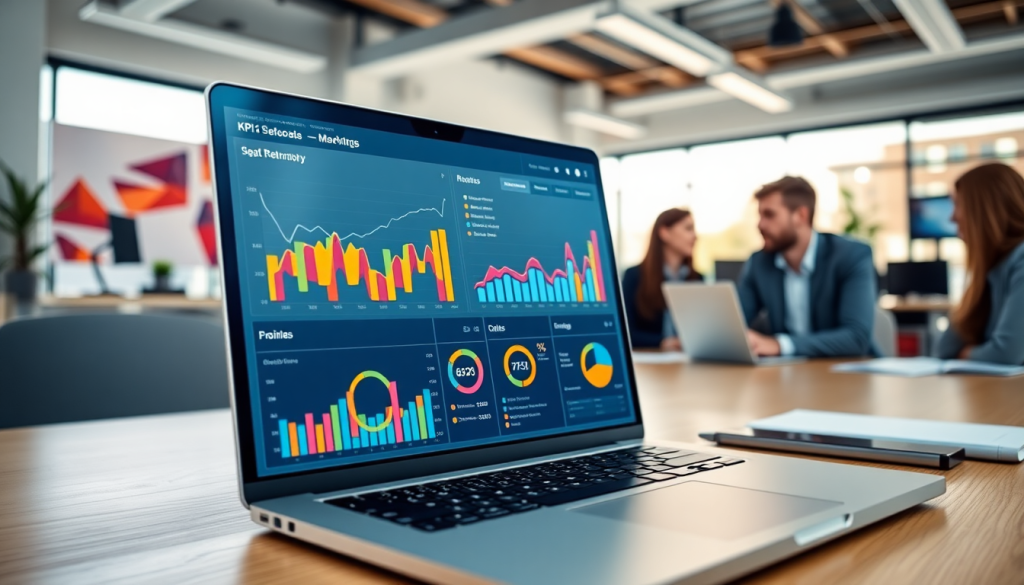
Digital Marketing KPI Dashboard: Visualize Campaign Metrics Fast
A digital marketing KPI dashboard empowers marketers and agencies to track, analyze, and act on their campaign performance in real time. With automated reporting, cross-channel analytics, and AI-driven insights, these dashboards turn raw data into clear, actionable stories—saving time and driving better marketing decisions. Whether you're managing dozens of campaigns or reporting to multiple clients, the right dashboard brings all your essential metrics together in one interactive view.
What is a Digital Marketing KPI Dashboard?
A digital marketing KPI dashboard is an interactive, visual platform that centralizes the most important performance indicators (KPIs) for your marketing campaigns. Unlike static spreadsheets or one-off reports, these dashboards pull data from multiple channels—search, social, display, email, and more—into a single, real-time view. The core purpose is to give marketers instant clarity on what's working, what needs attention, and where to optimize, all at a glance.
Typical users of digital marketing KPI dashboards include agencies managing campaigns for multiple clients, in-house brand marketers overseeing multi-channel strategies, and enterprise teams who need consolidated oversight across business units or locations. These dashboards are essential for anyone who wants to move beyond manual data wrangling and toward data-driven decision-making at scale.
What sets a KPI dashboard apart from standard reports or spreadsheets is its dynamic nature. Instead of sifting through rows of numbers or cobbling together data from disparate sources, a dashboard continuously updates with the freshest metrics, offers customizable visualizations, and allows users to drill down into specific campaigns or channels. This empowers marketers and stakeholders to monitor progress, identify trends, and act quickly—making the digital marketing KPI dashboard an indispensable tool for modern marketing teams.
Essential Metrics to Track in Your Dashboard
The power of a digital marketing KPI dashboard lies in its ability to spotlight the metrics that matter most for campaign success. Selecting the right KPIs (Key Performance Indicators) is crucial—not just for performance measurement, but for optimizing strategy and showcasing ROI to stakeholders.
Most Impactful Digital Marketing KPIs
For most digital campaigns, these core metrics form the foundation of effective tracking:
- Cost Per Click (CPC): Indicates how much you pay for each click in paid campaigns—key for budget efficiency.
- Click-Through Rate (CTR): Measures engagement by showing the percentage of impressions that result in clicks.
- Conversion Rate: Tells you how many visitors complete a desired action, such as a purchase or form submission.
- Return on Investment (ROI): Quantifies the profitability of your campaign, demonstrating the value delivered for every dollar spent.
- Impressions: Tracks the total number of times your ad or content is displayed—useful for brand awareness efforts.
- Engagement Metrics: Includes likes, shares, comments, and video views, crucial for organic and paid social media.
Channel-Specific Metric Selection
Not all metrics hold equal weight across channels. For instance:
- Search Marketing: CPC, CTR, Quality Score, and conversions are paramount, as they directly influence ad spend and efficiency.
- Social Media: Engagement rate, reach, follower growth, and social shares provide insight into content resonance and community growth.
- Display Advertising: Impressions, viewability rate, and post-click conversions help gauge both visibility and effectiveness.
- Email Marketing: Open rate, click rate, and unsubscribe rate track audience interest and message relevance.
A well-constructed dashboard should allow users to filter and visualize KPIs based on channel, campaign, or audience segment—empowering tailored analysis and agile decision-making.
Dig Deeper into Metric Selection
For a more comprehensive breakdown of which metrics to include and how to analyze them, check out the "Marketing Analytics Report: TapClicks Software for Powerful Insights". This guide explores advanced analytics and demonstrates how to translate raw data into actionable strategies.
By focusing your dashboard on the KPIs that drive business outcomes—and adapting metric selection to channel goals—you build a foundation for smarter, faster, and more impactful marketing decisions.
Key Benefits of Marketing Metrics Visualization
The true power of a digital marketing KPI dashboard lies in its ability to transform complex data into intuitive, visual narratives. Visual dashboards empower marketers and agencies to make quick, confident decisions—without sifting through spreadsheets or disparate reports. Instead of wrestling with raw numbers, teams can instantly grasp campaign performance through charts, graphs, and heatmaps that spotlight both the big picture and the granular details.
Visualization makes it easy to spot trends, outliers, and growth opportunities at a glance. For example, a sudden spike in click-through rates or an unexpected drop in conversions becomes immediately apparent—enabling faster response and proactive optimization. Heatmaps and time-series graphs help users identify peak performance periods, channel synergies, or underperforming tactics, all of which might be buried in traditional tabular data.
For agencies and in-house marketing teams, these visualizations also elevate client reporting and stakeholder engagement. Clean, interactive dashboards provide transparency, build trust, and foster buy-in by presenting results in a way that’s both accessible and impactful. Instead of lengthy explanations, you can let the visuals do the talking—demonstrating ROI, growth, and campaign impact with compelling, real-time evidence. Ultimately, marketing metric visualization bridges the gap between data and action, driving smarter strategies and stronger results across all digital channels.
How Automated KPI Reports Save Time and Reduce Errors
In the fast-paced world of digital marketing, manual reporting can quickly become a bottleneck—consuming valuable hours, introducing human error, and slowing down decision-making. Automation transforms this process, allowing teams to focus on strategy rather than data wrangling. With automated KPI reports, marketers benefit from scheduled data pulls, pre-built dashboard templates, and instant updates across all their campaigns.
Automated solutions like TapClicks streamline reporting by connecting directly to thousands of marketing and advertising platforms. Instead of logging into multiple dashboards or exporting CSVs, all your key metrics—from impressions and clicks to conversions and ROI—are aggregated and visualized automatically. This ensures your data is always up to date and your reports are ready whenever you (or your clients) need them.
Template-driven dashboards further accelerate the reporting process. Agencies and marketing teams can create reusable templates for common campaign types, channels, or clients, reducing setup time and maintaining consistency across reports. Automated scheduling ensures stakeholders receive timely updates without manual intervention, minimizing both delays and the potential for copy-paste mistakes.
For a deeper dive into these benefits, see "Marketing Dashboard Automation: Boost Agency Reporting Efficiency", which highlights how agencies have reclaimed 50+ hours per analyst each month by automating repetitive reporting tasks. Not only does this free up staff for higher-value analysis, but it also ensures data integrity, as automation drastically reduces the risk of manual entry errors.
Ultimately, automated KPI reporting delivers peace of mind and operational efficiency—empowering marketers to act quickly and confidently on insights, drive better campaign results, and scale their operations with ease. To explore how TapClicks can modernize your reporting workflow, visit TapClicks.
See the Whole Story: Why Cross-Channel Analytics Matters
Modern marketing rarely happens in just one channel. Search ads, social campaigns, display, email, and more—each generates its own ocean of data. But when those data streams remain siloed, the true impact of your campaigns can get lost in the noise.
What Cross-Channel Analytics Delivers
By bringing all your data together, cross-channel analytics helps you:
- Get a holistic view: See campaign performance, budget allocation, and ROI across every channel—side by side.
- Spot what others miss: Correlate trends, like how paid search conversions may spike when social engagement increases.
- Attribute results accurately: Understand which touchpoints are driving conversions or leads.
- Optimize in real time: Identify what’s working (and what’s not), so you can shift spend or tweak creative quickly.
Example Wins
- Connect the dots: Link display impressions to leads captured in email campaigns.
- Uncover hidden synergies: See how social buzz boosts search performance.
How TapClicks Makes Unification Effortless
TapClicks is purpose-built for this level of integration and insight. Here’s what sets it apart:
-
10,000+ Data Connectors
Instantly pull in data from Google Ads, Facebook, programmatic, email, CRM, e-commerce, and more. -
Automated ETL/ELT Pipelines
Extract, transform, and load all your marketing data—no more manual wrangling. -
Powerful Data Enrichment
Blend and normalize metrics for apples-to-apples comparisons across every channel, client, or campaign. -
Real-Time Dashboards
Visualize cross-channel performance instantly, with role-based access and custom views. -
Single Source of Truth
Centralize your data, eliminate manual aggregation, and reduce reporting errors—ensuring every stakeholder is aligned.
Ready to See Unified Analytics in Action?
Centralizing your marketing data with TapClicks unlocks:
- True campaign insights
- Faster, more accurate reporting
- Operational efficiency at scale
Curious what this could look like for your team? Explore TapClicks and discover how unified data drives smarter marketing.
AI Marketing Dashboards: From Data to Actionable Insights
The true promise of a modern marketing KPI dashboard lies in its ability to not just present data, but to transform it into actionable intelligence. AI-powered dashboards are leading this evolution, going far beyond static charts and traditional reporting. By leveraging machine learning and advanced algorithms, these smart dashboards automatically surface trends, detect anomalies, and recommend optimization strategies—giving marketers and agencies a strategic edge without the manual guesswork.
Instead of sifting through endless rows of metrics, AI-driven dashboards highlight what matters most. For instance, if a campaign’s conversion rate suddenly dips or a particular channel outperforms its budget, AI agents flag these anomalies in real time. This proactive approach enables teams to address issues or capitalize on opportunities immediately, rather than after the fact.
Predictive analytics also play a crucial role. AI dashboards can forecast campaign outcomes, benchmark performance against industry standards, and suggest budget reallocations to maximize ROI. These smart recommendations turn complex data into simple, actionable steps—helping marketers continuously optimize their strategies.
TapClicks is at the forefront of this transformation with a suite of AI-powered features. TapClicks’ AI Agents automatically analyze dashboards and datasets, surfacing insights and generating recommendations without manual intervention. The platform’s SmartEmail feature delivers AI-curated summaries directly to stakeholders, ensuring everyone stays informed and aligned. For those seeking next-level "interactive performance metrics", TapClicks’ predictive models and smart visualization tools empower users to move from data collection to data-driven action with unprecedented speed and clarity.
In an era where speed and insight are everything, AI marketing dashboards like those from TapClicks are redefining how marketers and agencies turn raw metrics into meaningful results.
Best Practices for Building a Performance Tracking Dashboard
Crafting an effective digital marketing KPI dashboard isn’t just about plugging in data—it’s about ensuring your team and stakeholders get the right insights at the right time, in the right format. Here are best practices to guide your dashboard design and optimization:
1. Prioritize Simplicity and Clarity
A great dashboard distills complex data into a clean, intuitive view. Avoid clutter by focusing on essential KPIs that align with your marketing objectives. Use whitespace strategically, group similar metrics, and limit the number of widgets per screen to prevent information overload.
2. Customize for Audience and Roles
Not every user needs the same data. Leverage role-based views to tailor dashboards for executives, campaign managers, or clients. For example, leadership may want high-level ROI and spend trends, while channel managers need granular CPC and conversion details. Customization enhances usability and relevance, driving faster adoption.
3. Enable Real-Time Updates
Today’s marketing landscape changes rapidly. Your dashboard should pull in fresh data automatically—ideally via scheduled imports or live integrations—so decisions are based on the latest campaign performance, not yesterday’s numbers.
4. Choose the Right KPIs and Visualization Types
Select KPIs that directly impact your goals and avoid vanity metrics. Pair each metric with the most effective visualization: use line graphs for trends, bar charts for comparisons, and heatmaps to highlight outliers. Interactive elements like filters and drill-downs can further enhance data exploration.
5. Optimize for Mobile and Accessibility
Marketers and clients need insights on the go. Ensure your dashboard is responsive, loads quickly on mobile devices, and supports accessibility standards. This keeps everyone connected to campaign health, wherever they are.
6. Commit to Continuous Optimization
A dashboard isn’t “set and forget.” Regularly review user feedback, analyze usage patterns, and adjust KPIs or layouts as your business goals evolve. Schedule audits to remove outdated widgets, add new data sources, and refine visualizations for clarity.
By following these best practices, you’ll build a performance tracking dashboard that delivers actionable insights, supports better decisions, and keeps your marketing team—and clients—a step ahead. For more on building scalable, customizable dashboards that fit your workflow, explore TapClicks as your unified marketing operations platform.
Conclusion: Choosing the Right KPI Dashboard for Your Marketing Team
A well-designed digital marketing KPI dashboard isn’t just a reporting tool—it’s a strategic asset that transforms campaign data into clear, actionable insights. By consolidating metrics across every channel and automating the reporting process, the right dashboard empowers your team to move faster, optimize smarter, and deliver greater value to every stakeholder.
When evaluating solutions, prioritize platforms that offer true scalability, seamless integration with your existing data sources, and advanced AI-driven features for insight generation. These capabilities ensure your dashboard grows with your business, adapts to shifting marketing needs, and always delivers the real-time intelligence you need to stay ahead.
Ready to take your campaign reporting and analytics to the next level? Explore how TapClicks unifies digital marketing data, automates KPI tracking, and provides interactive, AI-powered dashboards for agencies and brands at scale. With TapClicks, your team can focus less on data wrangling and more on making impactful, data-driven marketing decisions.
Start Automating Your Marketing Data Today!
No Credit Card Required.

