

Digital Marketing KPI Dashboard: Metrics & Performance Insights
A digital marketing KPI dashboard empowers marketers to see, understand, and act on campaign performance in one unified view. With real-time tracking, automated reporting, and interactive visualizations, these dashboards turn raw marketing data into actionable insights—making it easier to optimize spend, maximize ROI, and communicate results to stakeholders. Whether you’re managing multi-channel campaigns or seeking to streamline reporting workflows, the right dashboard can transform how you measure and improve marketing success.
What is a Digital Marketing KPI Dashboard?
A digital marketing KPI dashboard is a centralized, interactive platform designed to track, analyze, and visualize the key performance indicators (KPIs) that matter most to your marketing campaigns. At its core, this type of dashboard serves as your marketing command center—gathering real-time data from a wide range of sources, such as search engines, social media, programmatic advertising, and email marketing tools. By consolidating disparate metrics into one unified view, dashboards eliminate the need for manual data stitching and tedious spreadsheet work.
The main function of a KPI dashboard is to offer marketers a comprehensive overview of campaign health and ROI in just a few clicks. It automatically pulls in marketing data from multiple channels, blends and normalizes it, and presents it through intuitive visualizations. This makes it easy to monitor performance trends, identify opportunities, and spot potential issues before they impact results.
The benefits of using a digital marketing KPI dashboard are numerous. First, it drives efficiency by automating the collection and reporting of marketing data, freeing teams from repetitive manual tasks. Second, it brings clarity—turning raw, siloed information into actionable insights that are easy to interpret and share with stakeholders. Finally, it enables truly data-driven decision-making, empowering marketers to optimize spend, reallocate budgets, and refine strategy based on up-to-the-minute performance data.
For agencies and in-house teams alike, a well-designed dashboard is essential to streamlining workflows and delivering transparent, impactful reporting. To see how dashboard automation can significantly boost agency efficiency, check out this guide on marketing dashboard automation for agency efficiency.
Key Metrics Every Dashboard Should Track
A digital marketing KPI dashboard is only as powerful as the metrics it monitors. Selecting and tracking the right key performance indicators (KPIs) is fundamental to understanding campaign effectiveness, optimizing strategy, and aligning with business objectives. Here are the essential marketing KPIs every dashboard should include:
Click-Through Rate (CTR): Measures the percentage of users who click on an ad or link after seeing it. CTR is a direct indicator of creative relevance and audience engagement, helping marketers fine-tune messaging and targeting.
Cost Per Acquisition (CPA): Tracks the average spend required to acquire a new customer or lead. Monitoring CPA highlights how efficiently your campaigns are converting prospects, supporting smarter budget allocation.
Return on Investment (ROI): Calculates the profitability of marketing activities by comparing revenue generated to the costs incurred. ROI is the ultimate measure of campaign success and justifies continued investment—or signals the need to pivot.
Conversion Rate: Shows the proportion of users who complete a desired action (purchase, sign-up, download) after interacting with a campaign. High conversion rates reflect resonance with your audience and effectiveness of landing pages or calls-to-action.
Impressions: Counts how often your ads or content are displayed, regardless of clicks. Impressions help gauge brand visibility and campaign reach, especially important for awareness-driven strategies.
Engagement Rate: Aggregates likes, comments, shares, and other interactions, particularly on social platforms. Engagement metrics reveal content resonance and community activity—crucial for brand-building and organic growth.
Tailor Metrics to Business Goals: It’s vital to select KPIs that match your unique objectives. For example, an e-commerce brand may prioritize conversion rate and ROI, while a media company might focus on impressions and engagement. Customizing dashboards to reflect these priorities ensures every stakeholder—from executives to campaign managers—gets actionable information relevant to their role.
Granular vs. High-Level Metrics: Stakeholder needs vary. Executives often want high-level summaries (overall ROI, total spend, top-performing channels). Meanwhile, marketing teams benefit from granular metrics—such as individual ad group CTRs or specific keyword CPA—to inform day-to-day optimizations. The best dashboards allow users to toggle between summary and detailed views, ensuring everyone gets the insight they need.
Ultimately, what you track shapes what you improve. By carefully choosing and visualizing the right KPIs, you empower your team to move beyond raw numbers and drive sustained marketing success. To learn how automation can help agencies track these metrics efficiently, check out marketing dashboard automation for agency efficiency.
Marketing Metrics Visualization: Turning Data into Insights
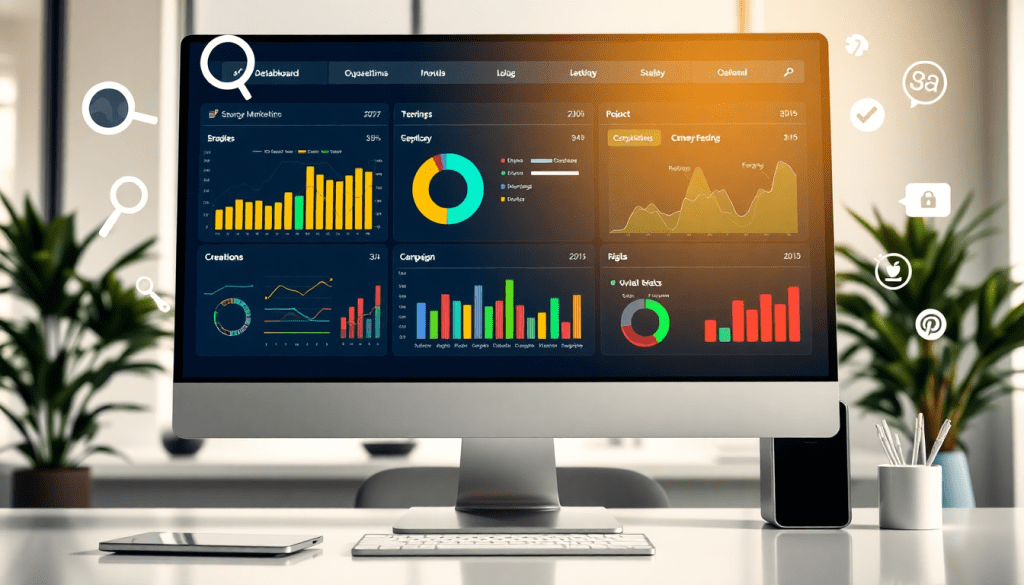
The power of a digital marketing KPI dashboard lies not just in collecting data, but in making that data instantly understandable and actionable. Clear, interactive visualizations—such as charts, graphs, and tables—transform raw numbers into a story, enabling marketers to spot trends, uncover patterns, and communicate results with confidence.
Best practices for visualizing marketing performance data start with simplicity and clarity. Choose the right chart type for your metric: line graphs for trends over time, bar charts for comparing campaign performance, and pie charts to show spend allocation. Use color coding consistently to highlight performance against goals—green for exceeding targets, yellow for approaching, and red for underperforming areas. Interactive dashboards should offer drill-down features, allowing users to move effortlessly from high-level KPIs to granular campaign details with just a click.
Effective visualization accelerates insight and action. When dashboards let you filter by channel, region, or audience segment, you can quickly pinpoint what’s working and where to pivot. Trend lines and benchmarking overlays provide valuable context, helping teams recognize whether a spike in conversions is a seasonal anomaly or the result of a successful new ad creative.
Ultimately, harnessing strong data visualization practices in your marketing dashboard removes guesswork, streamlines collaboration, and empowers faster, smarter decision-making. For a look at how analytics reporting automation can further enhance your dashboard’s impact, check out this guide on analytics reporting automation.
Stay Ahead with Real-Time Campaign Dashboards
In digital marketing, a moment’s delay can mean missed opportunities. That’s why real-time performance tracking dashboards are now essential for modern marketing operations. These dashboards deliver instant visibility into campaign metrics, allowing you to act on live data—so you’re always one step ahead.
What Real-Time Dashboards Bring to Your Workflow
Here’s how real-time dashboards transform campaign management:
- Immediate insights: Data from all your marketing and advertising platforms is pulled in continuously. No more waiting for static, outdated reports.
- Proactive optimization: Spot underperforming channels, identify winning tactics, and adjust budgets or creative in the moment.
- Full-funnel visibility: Track every stage of the customer journey, from first impression to final conversion.
Key Features to Look For
The most effective dashboards include widgets and visualizations tailored for marketing KPIs. Look for dashboards that offer:
- Live spend pacing meters: Instantly see if you’re on track with daily or campaign budgets.
- Conversion funnels: Drill into each step—see where prospects drop off and where they convert.
- Trend line graphs: Quickly visualize spikes, dips, and overall performance over time.
- Geographic heat maps: Understand which regions are driving the most leads or conversions.
- Custom alerts: Get notified the moment a KPI crosses a critical threshold—no more surprises.
| Dashboard Widget | What It Does |
|---|---|
| Spend Pacing Meter | Compares actual vs. budgeted spend in real time |
| Conversion Funnel | Visualizes drop-off and conversion rates at each stage |
| Trend Line Graph | Plots metrics for performance analysis over time |
| Geographic Heat Map | Highlights top-performing locations or regions |
| Custom KPI Alerts | Sends instant notifications for rapid-response management |
Why It Matters
With a centralized, real-time dashboard:
- Move from reactive to proactive: Make decisions as campaigns unfold, not after the fact.
- Save time: Automated integrations mean less manual data pulling and more strategic action.
- Boost ROI: Quickly reallocate spend, adjust creative, or shift strategy based on what’s working now.
How TapClicks Makes It Easy
TapClicks empowers agencies, media companies, and brands with:
- Dynamic dashboards: Customizable, scalable, and always up-to-date.
- Automated data integration: 10,000+ connectors for instant, unified campaign tracking.
- Smart alerts and insights: So you never miss a performance shift that matters.
Ready to see how unified, real-time dashboards can supercharge your marketing operations? Learn more with TapClicks.
Automated KPI Reports: Saving Time and Reducing Errors
Manual reporting is one of the biggest bottlenecks in digital marketing operations. Collating data from multiple platforms, formatting spreadsheets, and sending out updates are time-consuming tasks that are also prone to human error. Automating KPI report generation and delivery fundamentally transforms this process, freeing marketers from repetitive work and ensuring consistent, accurate insights.
With automated KPI reports, marketing teams can set up workflows that pull data from all relevant sources—search, social, display, and more—at scheduled intervals. This means stakeholders receive up-to-date performance snapshots without anyone having to manually export or compile data. Automation not only slashes reporting workload, but it also dramatically reduces the risk of mistakes from copy-pasting or outdated numbers.
Customization is another key advantage. Automated reporting platforms like TapClicks enable users to tailor report templates to specific audiences: from high-level executive summaries to granular campaign breakdowns for clients. Marketers can apply branding, choose which KPIs to highlight, and set delivery frequencies that match organizational rhythms—weekly, monthly, or on-demand.
Scheduling recurring reports ensures stakeholders always have the latest insights at their fingertips, while also providing a clear audit trail of marketing performance over time. Plus, with interactive dashboards and branded PDF exports, automated reports elevate your agency’s professionalism and client experience.
To see how automation can streamline your reporting and unlock deeper insights, check out this resource: "TapClicks reporting software for insights". With the right automation tools, your team can focus less on building reports—and more on strategic optimization and growth.
Cross-Channel Analytics Dashboard: See the Full Picture of Your Campaigns
Today’s marketing teams don’t operate in silos—and neither does your data. Whether you’re managing paid search, social, programmatic, or email, your audience and performance metrics are scattered across dozens of platforms. That’s why a cross-channel analytics dashboard is essential for any results-driven marketer.
Why Cross-Channel Analytics Changes the Game
Instead of jumping between disconnected reports, cross-channel analytics lets you:
- Aggregate & Normalize Data:
Combine metrics from Google Ads, Facebook, email, programmatic, and more into one unified dashboard. - See True Performance:
Identify which channels, messages, or campaigns are driving real business outcomes. - Optimize Budget & Strategy:
Reallocate spend and effort based on a holistic view instead of guesswork. - Uncover Interaction Effects:
Spot how different channels amplify each other (e.g., how social supports paid search).
How Does a Cross-Channel Dashboard Work?
Here’s the typical journey of your marketing data:
-
Collection:
Data is pulled from each source (search engines, social networks, DSPs, email platforms, CRMs, etc.) via robust connectors. -
Standardization:
Metrics are normalized—so a “conversion” means the same thing whether it’s from Google Ads or Facebook. -
Blending:
Data is combined for side-by-side and aggregated insights. For example:Channel Clicks Conversions Cost Paid Search 5,000 200 $10,000 Paid Social 3,200 150 $7,500 Email 700 50 $1,000 Total 8,900 400 $18,500 -
Visualization:
Drag-and-drop dashboards let you filter, drill down, and customize views for different stakeholders.
Common Challenges—and How TapClicks Solves Them
Managing cross-channel data isn’t always easy. Marketers often face:
- Inconsistent naming (e.g., “impressions” vs. “views”)
- Varying data structures and formats
- Complex integrations with hundreds (or thousands) of sources
TapClicks addresses these pain points with:
- 10,000+ Connectors: Seamlessly integrate virtually any marketing, advertising, or business platform.
- Automated ETL/ELT: Extract, transform, and load your data—no manual wrangling required.
- Enrichment Tools: Blend and normalize datasets for apples-to-apples comparisons.
- AI-Driven Insights: Go beyond dashboards—uncover what’s working and optimize in real time.
Why This Matters for Marketing Teams
With a cross-channel analytics dashboard powered by TapClicks, you can:
- React faster to trends and campaign performance shifts.
- Automate reporting and free your team from manual number crunching.
- Prove ROI and demonstrate value across all digital touchpoints.
A unified dashboard isn’t just a convenience—it’s your competitive edge in a complex marketing world.
Ready to see how TapClicks can unify your data and drive better results? Learn more.
ROI Tracking and Optimization: Proving and Improving Marketing Value
A digital marketing KPI dashboard is more than just a place to monitor clicks and impressions—it’s your command center for measuring, demonstrating, and improving the real value of your marketing efforts.
Instantly Monitor ROI and Budget Pacing
Key Benefits:
- Live Budget Tracking: Instantly see if you’re overspending, underspending, or on target with budget pacing widgets.
- Real-Time Performance: Monitor spend as campaigns unfold and adjust allocations before issues escalate.
- Automated Metrics: Dashboards automatically calculate:
- Cost per Acquisition (CPA)
- Return on Ad Spend (ROAS)
- Overall ROI
Why It Matters:
These real-time insights make it easy to demonstrate impact to stakeholders and guide smarter investment decisions.
See the Full Picture in Multi-Touch Campaigns
What Makes This Powerful:
- Unified Data: Aggregate and normalize spend and conversion data across all your channels (search, social, display, etc.).
- Customer Journey Mapping: Track the entire path from first touch to final conversion.
- Attribution Modeling: Assign value to each channel and touchpoint with built-in models.
How This Helps:
You’ll know exactly which platforms drive ROI, how they work together, and where to allocate budget for maximum impact.
Let AI Do the Heavy Lifting for Optimization
Put AI to Work:
- Automated Insights: AI agents (like those in TapClicks) continuously analyze your campaign data.
- Smart Recommendations: Instantly surface underperforming channels and receive suggestions for budget reallocations.
- Predictive Power: Forecast which campaigns are most likely to achieve your goals, so you can double down on what works.
The Result:
Continuous, data-driven optimization—no more relying on gut instinct.
What Can You Achieve with Smarter ROI Tracking?
- Prove the value of every marketing dollar to clients and execs
- Spot inefficiencies before they become costly mistakes
- Move from reactive reporting to proactive optimization
| Feature | What You Get | Why It Matters |
|---|---|---|
| Budget Pacing Widgets | Live spend and performance tracking | Prevent overspending |
| Multi-Channel Attribution | Unified customer journey view | Smarter budget allocation |
| AI Recommendations | Automated insights and optimizations | Higher ROI, less manual analysis |
By bringing ROI tracking and optimization together in one dashboard, you empower your team to make better, faster, and more profitable marketing decisions—every single day.
Choosing the Best AI Marketing Dashboard: What to Look For
Selecting the right AI-powered marketing dashboard is a game-changer for teams seeking more than just consolidated data—they want actionable intelligence, flexibility, and scalability. Here’s what to prioritize when evaluating advanced dashboards:
1. AI-Driven Insights and Recommendations
Look for dashboards that go beyond static reporting and leverage AI to surface trends, flag anomalies, and recommend optimizations. Platforms like TapClicks offer AI Agents and automated insight summaries via SmartEmail, turning raw data into clear, proactive recommendations for both internal teams and clients.
2. Customization and Scalability
No two organizations are alike, so your dashboard should be highly configurable. Leading solutions provide drag-and-drop widgets, branded reporting studios, and customizable data views to suit everything from executive summaries to granular campaign deep-dives. Scalability is crucial—ensure the platform can support hundreds or thousands of dashboards and reports without performance dips, especially if you’re managing multiple brands, clients, or locations.
3. Seamless Data Integration
A top-tier dashboard should connect with all your marketing, advertising, and business platforms. TapClicks stands out with over 10,000 connectors and automated ETL/ELT pipelines, making it easy to unify data from search, social, programmatic, email, and more. This robust integration ensures you always have a comprehensive, up-to-date view.
4. Workflow Automation
Efficiency is key—opt for dashboards that automate routine tasks such as data pulls, report generation, and distribution. This not only saves time but also reduces manual errors. TapClicks, for example, automates scheduled report delivery and supports collaborative workflows, streamlining operations across sales, ops, and fulfillment teams.
5. Actionable Analytics and Collaboration
The best dashboards empower teams to take action. Features like role-based access, comment threads, and instant sharing facilitate collaboration and ensure stakeholders stay aligned. Additionally, real-time performance monitoring lets marketers respond quickly to shifts in campaign performance.
How TapClicks Compares
While many competitors—such as Funnel.io, Agency Analytics, and Supermetrics—offer point solutions for data aggregation or lightweight reporting, TapClicks uniquely combines unified data, advanced AI insights, and workflow automation at scale. This all-in-one approach means less time stitching together tools, and more time improving marketing outcomes with actionable, AI-powered intelligence.
Evaluating Vendors: What Matters Most
When choosing a dashboard provider, focus on:
- The depth and breadth of integrations
- The sophistication of AI insights and automation
- Customization and scalability to match your growth
- Workflow features that reduce busywork and support team collaboration
- A proven track record with agencies, brands, and enterprises at scale
By prioritizing these features, you’ll ensure your marketing dashboard isn’t just a reporting tool—it’s a strategic advantage, driving smarter decisions and better results across every campaign.
Conclusion
A digital marketing KPI dashboard isn’t just a reporting tool—it’s the command center for modern marketers who want to streamline performance tracking, automate reporting, and drive smarter optimization. By unifying data from every channel and presenting key metrics in intuitive, actionable formats, these dashboards empower teams to make faster, more informed decisions while saving countless hours on manual tasks. Whether you’re aiming to maximize ROI, prove campaign value, or simply keep stakeholders in the loop, investing in the right dashboard technology can yield transformative results.
Now is the time to evaluate whether your current tools are helping or hindering your ability to deliver clear, timely marketing insights. Consider exploring advanced solutions like TapClicks, which offer scalable, AI-powered dashboards designed for seamless data integration, automation, and actionable reporting. Take the next step—try a demo or dive into additional resources—and experience firsthand how the right dashboard can elevate your marketing operations and outcomes.
Start Automating Your Marketing Data Today!
No Credit Card Required.

