

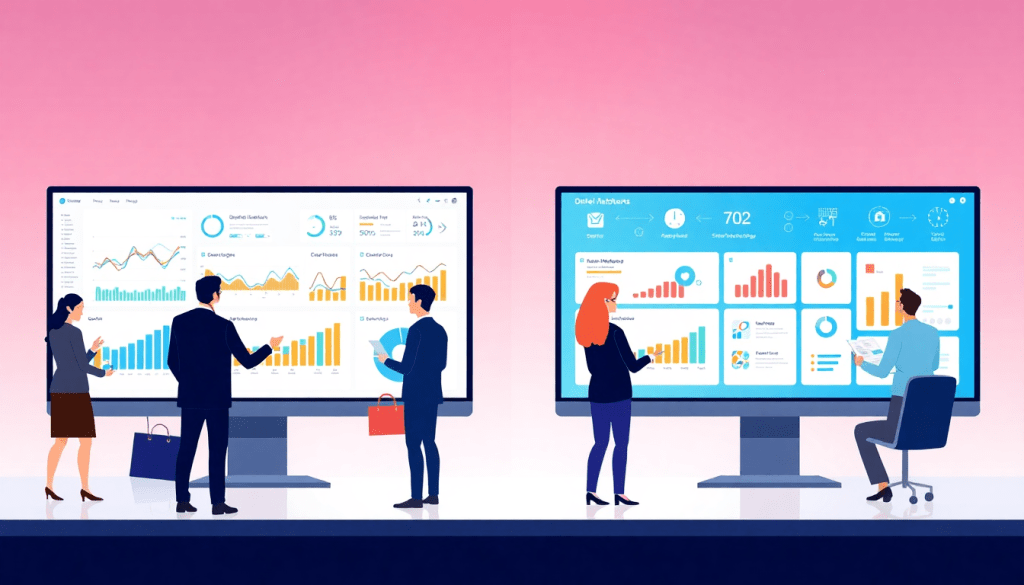
Best Marketing Reporting Software: TapClicks vs Funnel.io
With hundreds of marketing reporting tools promising easy dashboards, automation, and client-ready insights, agencies face a real challenge: finding a platform that truly meets their needs for scale, efficiency, and actionable analytics. This guide breaks down the real differences between TapClicks and Funnel.io—the two leading choices for agency reporting automation. We’ll compare their marketing analytics dashboards, automated performance reports, cross-channel data integration, and the features that actually move the needle for agencies managing dozens (or thousands) of clients.
What Makes the Best Marketing Reporting Software for Agencies?
For marketing agencies, the best reporting software isn’t just about generating attractive charts or pulling in data from a few ad platforms. True excellence in agency reporting platforms comes down to a handful of critical capabilities: scalability, automation, white-labeling, cross-channel reporting, and ease of use.
Scalability
Agencies often juggle dozens—or even thousands—of client accounts, each with their own unique campaigns, data sources, and reporting needs. The ideal platform must handle high volumes of data, dashboards, and users without buckling under pressure. Scalability ensures agencies can grow their book of business without outgrowing their reporting tool.
Automation
Manual reporting is not just tedious; it’s a drag on profitability and a risk for human error. The best solutions offer deep automation—pulling fresh data, blending sources, and delivering scheduled reports with minimal intervention. This lets teams focus on strategy, not spreadsheet wrangling, and helps agencies reallocate hours toward higher-value client services.
White-Labeling
Client trust is paramount. Agencies need to reinforce their brand throughout the reporting experience, from login screens to dashboard themes and exported PDFs. Robust white-labeling capabilities allow agencies to present insights as their own, deepening client relationships while maintaining a polished, professional image.
Cross-Channel Reporting
Modern marketing is multi-channel by nature. Whether it’s paid search, social, programmatic, or offline campaigns, clients expect a unified view of performance. The best marketing reporting software seamlessly integrates data from dozens (or hundreds) of platforms, normalizing metrics for apples-to-apples analysis and holistic insights.
Ease of Use
Finally, the platform must be intuitive for both agency staff and clients. Drag-and-drop dashboards, customizable visualizations, and self-service access empower both analysts and account managers to deliver insights fast—without hours of onboarding or technical training.
These features aren’t just “nice to have”—they’re essential for agencies that want to reduce churn, demonstrate value, and scale efficiently. For a more detailed checklist and a side-by-side breakdown of how TapClicks and Funnel.io stack up on these criteria, check out "Best Marketing Reporting Software: TapClicks vs Funnel.io".
Why Agencies Love TapClicks for Reporting
Managing dozens—or hundreds—of clients means your reporting platform must do more than just visualize data. TapClicks is purpose-built for agencies needing scale, automation, and the ability to impress clients with actionable insights. Here’s how TapClicks moves beyond the basics:
All Your Data, All in One Place
- Connect to Everything:
Instantly integrate with over 10,000 marketing, advertising, and business data sources—no more stitching together siloed feeds or juggling point tools. - Unified Campaign Views:
See cross-channel analytics and holistic campaign performance for every client, even in complex, multi-channel environments.
Your Brand, Your Way
- Drag-and-Drop Dashboards:
Design custom dashboards with ease—no coding required. - White-Label Everything:
Apply your agency’s branding to every report and dashboard. - Granular Data Controls:
Decide exactly what each client or stakeholder can see, ensuring privacy and clarity.
Set-and-Forget Reporting Automation
- Automated Scheduling:
Set up recurring, fully branded reports delivered directly to clients or internal teams. - Error Reduction:
Eliminate manual spreadsheet wrangling and reduce reporting mistakes. - Role-Based Access & Collaboration:
Give just the right people the right access—while supporting seamless teamwork across sales, ops, and fulfillment.
From Data to Action: AI-Powered Insights
- Track Every KPI:
Visualize and optimize ROAS, CTR, CPA, and more across all channels. - AI Agents Built In:
Use TapInsights and SmartPilot to surface actionable recommendations, benchmark results, and predict performance trends. - Move Past “Just Reporting”:
Go from static reports to true data-driven optimization.
See TapClicks in Action
Curious how these features come together? Check out our in-depth guide:
👉 TapClicks Analytics Dashboard
Why It Matters
With TapClicks, agencies get:
| Benefit | What It Means for You |
|---|---|
| Scalability | Manage thousands of clients, dashboards, and reports effortlessly |
| Automation | Save 50+ hours per analyst per month |
| Customization | Deliver branded, client-specific experiences |
| AI-Driven Insights | Unlock optimization—not just reporting |
Ready to see how TapClicks can transform your agency’s reporting?
Explore more at TapClicks.
Funnel.io Overview: Capabilities and Limitations
Funnel.io is a marketing data aggregation tool designed to simplify how agencies and marketers collect and organize data from their entire digital ecosystem. At its core, Funnel.io excels at connecting to hundreds of marketing, advertising, and analytics platforms—Google Ads, Facebook, LinkedIn, and more—and automatically pulling raw data into a centralized hub. Users can then transform, clean, and map this data before pushing it into destinations like Google Data Studio, Tableau, Power BI, or spreadsheets for further analysis and reporting.
However, Funnel.io’s primary strength—data piping—also highlights its main limitation for agencies. While it offers basic dashboarding and visualization options, the platform is fundamentally focused on extracting, transforming, and loading (ETL/ELT) marketing data, not on providing a full suite of reporting, analytics, and workflow tools within the platform itself. Agencies that need to build client-facing dashboards, automate scheduled performance reports, or provide self-serve access to branded insights often find themselves supplementing Funnel.io with additional point solutions or BI tools.
Unlike TapClicks, which integrates data management, analytics dashboards, white-label reporting, and workflow automation into one unified platform, Funnel.io stops short at visualization and does not offer robust features for client collaboration, advanced visualization, or automated report distribution. This means agencies seeking end-to-end reporting automation, granular access controls, or actionable client dashboard insights may need to look elsewhere or invest in custom development.
For a detailed side-by-side feature comparison, see the "Best Marketing Reporting Software: TapClicks vs Funnel.io" guide.
Head-to-Head Comparison: TapClicks vs Funnel.io
To help agencies choose the right marketing reporting platform, here’s a direct comparison of TapClicks and Funnel.io across the features that matter most for high-volume reporting, automation, and client service. For an even deeper breakdown, see Best Marketing Reporting Software: TapClicks vs Funnel.io (Part 2).
| Feature | TapClicks | Funnel.io |
|---|---|---|
| Data Connectors & Integration | 10,000+ connectors including marketing, ad, and business data; custom Smart Connectors for unique sources; automated ETL/ELT pipelines | 500+ marketing and advertising connectors; strong data aggregation; limited enrichment and transformation tools |
| Dashboard & Visualization | Drag-and-drop dashboards; fully branded, customizable; cross-channel data blending; supports thousands of dashboards for multi-client setups | Basic dashboards focused on data tables and charts; less emphasis on visualization depth or brand customization |
| Automated Reporting & Scheduling | Robust automation—scheduled, recurring reports, internal and client-facing; SmartEmail for AI-generated insights; role-based delivery | Scheduled exports and dashboard sharing; lacks advanced scheduling and AI insight features |
| Scalability (Multi-Client/Location) | Designed for agencies and enterprises managing 100s–1000s of clients/locations; advanced user and permission controls | Suitable for single brands or small agencies; increased manual work as client count rises |
| Client Collaboration & White-Labeling | Role-based client access; white-label portals and reports; collaborative workflow tools for sales and ops | Limited client portal capabilities; white-labeling available but less customizable |
| Pricing Structure | Flexible plans tailored for agencies and multi-client organizations; scales with usage and features | Pricing based on data sources and volume; can increase quickly with data/clients |
Key Takeaways:
- TapClicks stands out for its ability to unify data, scale reporting across hundreds of clients, and automate both analytics and recurring report delivery. Agencies benefit from deep customization, robust white-labeling, and workflow features built for multi-client operations.
- Funnel.io excels at piping data into BI tools and offers straightforward aggregation, but agencies looking for a turnkey reporting platform with automated insights, dashboards, and client management will find TapClicks far more comprehensive.
For agencies seeking a platform that grows with their client roster and automates the most time-consuming reporting tasks, TapClicks delivers unmatched value and scale.
Reporting Automation for Agencies: Why It Matters
For agencies juggling multiple clients, brands, and campaigns, reporting can be a time-consuming and error-prone process—one that often eats into valuable hours better spent on strategy and optimization. That’s where reporting automation becomes a game-changer. By automating data pulls, report creation, and delivery, agencies can dramatically reduce manual work, minimize human error, and ensure consistency in every client-facing dashboard or summary.
Time Savings and Error Reduction
Manual reporting typically requires logging into multiple ad platforms, exporting spreadsheets, and cobbling together data for each client. This approach is not only inefficient, but also increases the risk of copy-paste mistakes or outdated numbers. With a robust marketing operations platform like TapClicks, agencies can set up automated reporting pipelines that pull in fresh data from over 10,000 marketing, advertising, and business sources. Scheduled reports and dashboards are automatically updated and delivered—saving analysts 50+ hours per month and significantly reducing the chance for human error.
Scalability and Client Relationship Impact
As agencies grow, so does the complexity of their reporting needs. Reporting automation makes it possible to scale without adding headcount or sacrificing quality. TapClicks, for example, supports thousands of dashboards, multi-location rollups, and role-based access. This means agencies can provide tailored, up-to-date insights for every client, from SMBs to enterprise brands, without missing a beat. Timely and accurate reporting builds trust and transparency—key drivers of strong, long-lasting client relationships.
TapClicks Features That Power Reporting Automation
- Scheduled Delivery: Automate the timing and frequency of report distribution, ensuring clients and internal teams always have the latest performance data.
- Role-Based Access: Fine-tune dashboard and report visibility by user type—empowering account managers, sales, and clients with the right level of insight.
- Campaign Tracking: Track budgets, pacing, cross-channel KPIs, and performance trends in real time, all within unified, branded dashboards.
- White-Labeling: Deliver fully branded reports and portals, reinforcing your agency’s value and professionalism.
By leveraging these automation features, agencies can spend less time on repetitive reporting tasks and more time on driving results and client strategy. For a deeper dive into how TapClicks automates marketing reporting at scale, see "TapClicks Analytics Dashboard".
Digital Marketing Data Visualization & Client Dashboard Insights
When it comes to marketing reporting, data without context is just noise. That’s why clear, customizable dashboards are a non-negotiable for agencies aiming to impress clients, drive informed decisions, and showcase the true value of their campaigns. The right dashboard turns raw numbers into a compelling story, making complex performance data accessible and actionable for both account teams and clients.
TapClicks stands out for its robust approach to digital marketing data visualization. Its drag-and-drop dashboard builder enables agencies to create highly tailored, branded client portals that highlight what matters most—whether that’s cross-channel performance, budget pacing, or granular campaign KPIs. TapClicks supports dozens of widget types, dynamic visualizations, and multi-level filtering, so agencies can surface insights for executive summaries or deep-dive analytics with just a few clicks.
A key differentiator is TapClicks’ ability to blend and normalize data from over 10,000 connectors, then present that unified view in a single dashboard. This means agencies can aggregate Google Ads, Facebook, programmatic, SEO, and even offline data into a cohesive client narrative. The platform also offers role-based access controls, so teams can share dashboards securely and give clients real-time visibility without risking sensitive information.
But visualization isn’t just about pretty charts—it’s about action. TapClicks’ AI-powered insights (via TapInsights and SmartPilot) automatically surface trends, anomalies, and optimization opportunities directly within the dashboard, saving time on manual analysis and helping agencies proactively guide client strategy. For a deeper exploration of these capabilities, see the "TapClicks Analytics Dashboard" breakdown.
Funnel.io, by contrast, focuses primarily on data aggregation and piping. While Funnel.io does provide dashboarding features, its visualization options are more basic and often require exporting data into external BI tools like Looker or Tableau for rich reporting. Agencies needing out-of-the-box, client-facing dashboards with advanced customization or interactive insights may find Funnel.io’s reporting less flexible and less intuitive for daily client communication.
Ultimately, agencies that prioritize powerful, flexible dashboards and built-in insights for client reporting will find TapClicks’ digital marketing data visualization tools far more comprehensive. The ability to customize every aspect of the dashboard experience—and to automate insight delivery—means agencies can elevate their client relationships and prove ROI with clarity and confidence.
How to Track the Right Performance Marketing KPIs—Without the Headache
Tracking performance marketing KPIs like ROAS, CTR, CPA, CPL, and conversion rates is at the heart of effective campaign optimization and clear client reporting. But with data scattered across platforms, even a simple “how are we doing?” can become a complex data chase.
The right marketing reporting software can make all the difference, turning KPI chaos into actionable insight—fast.
What Makes TapClicks Different?
TapClicks takes the guesswork and grunt work out of KPI tracking across platforms. Here’s how:
- Custom Dashboards: Instantly build widgets for ROAS, CTR, CPA, and more with a drag-and-drop interface.
- Connects Everything: Pull data seamlessly from paid search, paid social, display, and offline channels.
- Cross-Channel Comparison: Blend and normalize KPIs so you can compare apples to apples across platforms or locations.
- Calculated Metrics: Create advanced custom formulas and benchmarks tailored to each client’s goals.
- Automated Insights: Schedule branded reports that keep clients (and your team) in the loop—no manual compiling required.
| Feature | TapClicks | Funnel.io |
|---|---|---|
| Native KPI Visualization | Yes—robust, customizable dashboards | Limited—basic only |
| Cross-Channel KPI Blending | Yes—normalize & compare across sources | No—requires external BI tools |
| Automated Reporting | Yes—branded, scheduled, at scale | No—manual or via third-party |
| Custom Calculated Metrics | Yes | Limited |
| Scalability | Built for thousands of dashboards | Data pipe only |
Funnel.io: Good Data Pipe, But Not a Reporting Engine
While Funnel.io excels at aggregating data and passing it along to BI tools like Tableau or Looker Studio, it leaves most KPI visualization and analysis to those external platforms. This adds layers of complexity and slows down your reporting cycles—especially if you’re managing dozens (or hundreds) of clients.
What to Look for in Your KPI Reporting Platform
Keep these must-haves in mind:
- Unified Cross-Channel Analytics: Merge all client KPIs into a single, holistic view.
- Customization for Your Needs: Build custom KPIs, set unique benchmarks, and establish calculated fields.
- Automated, Branded Delivery: Save time with scheduled reports that keep everyone informed—no manual effort required.
- True Scalability: Choose a platform that can handle growth, managing countless dashboards and KPIs as your agency scales.
Why Agencies Rely on TapClicks
If you’re juggling multiple clients, campaigns, and channels, TapClicks is built to simplify your KPI world. With unified analytics, easy dashboarding, and automation baked in, TapClicks streamlines KPI tracking and reporting—so you can focus on optimization and client results, not wrangling spreadsheets.
Choosing the Best Fit for Your Agency
Selecting the right marketing reporting software isn’t just about ticking boxes—it’s about finding a platform that aligns with your agency’s scale, workflow, and client expectations. As we’ve seen, TapClicks and Funnel.io each have distinct strengths, but the best fit depends on your agency’s unique requirements.
For agencies juggling hundreds or thousands of clients, TapClicks stands out with its robust, unified analytics dashboards, deep automation, and scalable reporting infrastructure. Its end-to-end platform centralizes data integration, visualization, and workflow, meaning less time spent on manual tasks and more time delivering insights that drive client satisfaction. Features like scheduled, branded reports, role-based access, and AI-powered recommendations allow agencies to operate efficiently and maintain a competitive edge.
Funnel.io, while a strong contender for data aggregation and straightforward data piping, is often best suited for agencies that already have a separate BI stack or that prioritize custom data feeds over native, client-ready dashboards and automated reporting.
To determine which platform is right for you, start by assessing your agency’s current pain points:
- Do you need to automate repetitive reporting tasks and save analyst time?
- Is white-labeling and client dashboard access essential for your brand experience?
- How important is it to blend data from multiple channels and visualize performance in real-time?
- Are you looking for AI-powered insights and recommendations, or just reliable data aggregation?
If you’re looking for a solution built for agencies that need to scale, automate, and impress clients with actionable insights, TapClicks is the clear choice. To experience the platform firsthand and see how it can transform your reporting operations, schedule a personalized demo today. The right reporting platform isn’t just a tool—it’s a competitive advantage for your agency’s growth.
Start Automating Your Marketing Data Today!
No Credit Card Required.

