

Automated KPI Reporting Dashboard: TapClicks AI Platform Guide
Effective marketing analytics depend on accurate, timely, and actionable insights. The TapClicks AI platform streamlines the entire process of KPI reporting, dashboard creation, and performance tracking—automating what used to take hours or days. This guide explains how TapClicks empowers agencies, brands, and enterprise teams to unify their data, visualize results, and make smarter decisions with AI-driven dashboards and reporting.
Why Automated KPI Reporting Matters
Manual reporting can feel like a never-ending game of catch-up for marketing teams, agencies, and enterprise organizations. Siloed data sources, patchwork spreadsheets, and disconnected dashboard tools lead to:
- Fragmented analytics: Teams juggle multiple platforms, risking inconsistencies and duplicate effort.
- Slow, error-prone processes: Manual updates delay insights—and mistakes in data entry or formulas can create costly inaccuracies.
- Misaligned KPIs: When everyone’s working from different numbers, trust and decision-making take a hit.
What’s at Stake with Slow or Inaccurate Reports?
When reports are late or unreliable, the consequences are real:
- Missed opportunities: Delayed campaign performance updates mean you can’t pivot budgets or tactics in real time.
- Eroded trust: Clients and executives lose confidence when reports are error-filled or inconsistent.
- Wasted resources: More time spent wrangling spreadsheets means less time on strategic work.
How Automation Changes the Reporting Game
Automated KPI reporting addresses these pain points by:
- Unifying your data: Aggregates campaign results across platforms into a single source of truth.
- Normalizing and enriching datasets: Ensures apples-to-apples comparisons, even across disparate channels.
- Visualizing insights instantly: Drag-and-drop dashboards make it easy to spot trends and share updates.
- Delivering reports on schedule: Set-it-and-forget-it scheduling and automated alerts keep everyone in the loop.
For Agencies & Multi-Channel Marketers
- Manage hundreds of campaigns with less manual effort.
- Scale reporting without scaling headcount.
- Spend more time on strategy and client service—not spreadsheets.
For Brands & Enterprises
- Gain always-on access to up-to-date KPIs.
- React quickly to performance shifts with real-time data.
- Enable collaboration across teams with a single, reliable analytics hub.
More Than Time Savings: Key Benefits at a Glance
| Benefit | Manual Reporting | Automated KPI Reporting |
|---|---|---|
| Time to Insight | Days or hours | Minutes or real time |
| Error Risk | High | Low |
| Data Consistency | Variable | Always-on |
| Agility for Optimization | Slow | Instant |
| Team Morale & Client Trust | Erosion over time | Improved |
Ready to See the Impact?
Automated KPI reporting isn’t just about working faster—it’s about working smarter, with fewer errors and more strategic focus. The result? Happier clients, stronger results, and a marketing team that’s always one step ahead.
Want a deeper dive? Check out how marketing dashboard automation boosts agency reporting efficiency.
TapClicks AI Platform: Core Features for Reporting Automation
TapClicks stands out as a comprehensive marketing operations platform designed to automate every aspect of KPI reporting and dashboard management—offering agencies, brands, and enterprise teams a unified, AI-powered solution. At its core, TapClicks combines four essential pillars: robust data integration, intuitive dashboard creation, AI-driven reporting assistance, and seamless workflow automation.
Data Integration at Scale: Central to TapClicks’ reporting automation is its vast library of 10,000+ Smart Connectors, enabling unified marketing analytics automation across virtually every advertising, analytics, and business platform. These connectors not only extract data but also transform and normalize it, ensuring that cross-channel, multi-location, and multi-client datasets are blended and ready for analysis. Agencies and brands no longer need to wrangle with siloed reports or manual data pulls—data flows in automatically and securely.
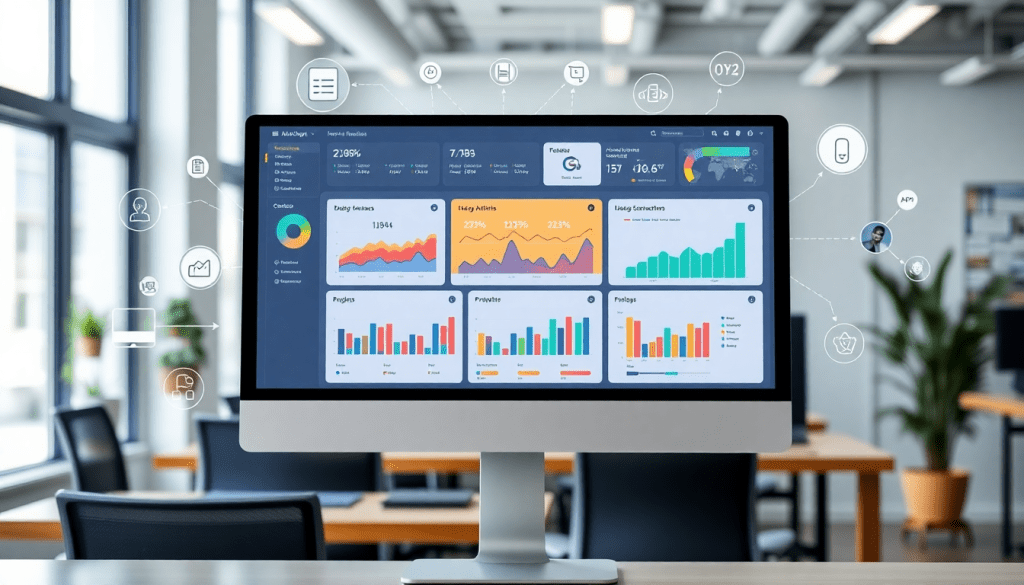
Automated Dashboard Creation: TapClicks’ drag-and-drop dashboard builder empowers users to create customized, branded dashboards in minutes. Whether you’re tracking paid media across Google, Facebook, and TikTok, or centralizing franchise performance for hundreds of locations, TapClicks enables automated dashboard creation for cross-channel performance tracking and client analytics automation. Dashboards can be tailored for different stakeholders—executives, account managers, or clients—ensuring everyone has instant access to the KPIs that matter most.
AI Reporting Assistant: With TapClicks’ AI capabilities, reporting moves from static charts to actionable intelligence. The AI reporting assistant surfaces insights, detects anomalies, and recommends optimizations—saving hours of manual analysis. Automated summaries and insights can be scheduled for delivery, transforming how teams monitor performance and make data-driven decisions.
Workflow Automation: TapClicks streamlines the entire reporting process with workflow tools that automate order management, campaign fulfillment, and stakeholder collaboration. From sales to operations, every team benefits from centralized task tracking and communication—eliminating bottlenecks and reducing reporting workload by over 50 hours per month for many users.
To see how TapClicks’ AI-powered integration tools can benefit your business, explore "AI Marketing Data Integration Tool: TapClicks Industry Benefits". With TapClicks, marketing teams can finally unify, automate, and elevate their reporting—at scale and with AI-driven insight.
Setting Up an Automated KPI Reporting Dashboard
Launching an automated KPI reporting dashboard with TapClicks is straightforward, thanks to its intuitive design and powerful automation tools. Here’s how to get started and maximize efficiency:
1. Connect Your Data Sources
Start by leveraging TapClicks’ extensive 10,000+ Smart Connectors to unify all your marketing, advertising, and business data. With a few clicks, you can pull in data from platforms like Google Ads, Facebook, programmatic platforms, CRM tools, and more. TapClicks’ automated ETL/ELT pipeline ensures data is extracted, transformed, and loaded without manual intervention—eliminating silos and reducing errors from manual imports.
2. Select and Define Key Performance Indicators (KPIs)
Identify the metrics that matter most to your team or clients. TapClicks enables you to select from a wide array of pre-built KPIs or create custom ones tailored to your objectives—whether that’s leads generated, ROAS, multi-channel spend, or location-based conversions. The platform’s enrichment tools allow you to blend and normalize datasets, ensuring cross-channel KPIs are consistent and meaningful.
3. Configure and Customize Your Dashboard
With your data connected and KPIs defined, use TapClicks’ drag-and-drop dashboard builder to design tailored views for each stakeholder. Choose from a range of visualization widgets—charts, graphs, tables, and scorecards—to present your data in the most impactful way. You can quickly clone dashboards for different clients, campaigns, or locations, and apply custom branding for a professional, unified client experience.
Tips for Streamlined Dashboard Creation:
- Start with TapClicks’ dashboard templates, then customize layouts and widgets as needed.
- Use filters and date ranges to give users the ability to drill down into specific channels, markets, or time periods.
- Automate dashboard updates so stakeholders always see the latest data without any manual refreshes.
4. Schedule and Automate KPI Reporting
TapClicks makes it easy to automate report generation and delivery. Set up automated schedules to deliver dashboards or summary reports to internal teams or clients—daily, weekly, or monthly. With SmartEmail, you can go a step further by sending AI-generated insight summaries directly to stakeholders’ inboxes, keeping everyone informed with zero manual effort.
Best Practices for Scalable Reporting Automation:
- Standardize dashboard templates across clients or departments for consistency and rapid onboarding.
- Leverage TapClicks’ role-based access controls to ensure the right people see the right data.
- Regularly review and update your KPIs to align with evolving business goals or campaign priorities.
By following these steps, marketing teams can scale their analytics operations, reduce manual workloads, and deliver timely, actionable KPI reporting at any volume. To learn more about how TapClicks can transform your reporting process, visit TapClicks.
Advanced AI Insights & Reporting Assistant Capabilities
TapClicks takes automated KPI reporting far beyond static dashboards with its advanced AI reporting assistant, unlocking actionable insights at scale. At the heart of this capability is TapClicks’ AI-powered analytics engine, which continuously monitors campaign performance across all channels to surface trends, anomalies, and opportunities—automatically.
With the TapClicks AI assistant, teams no longer need to dig through countless charts to find what matters. The system proactively analyzes datasets and dashboards, highlighting campaign performance insights such as sudden shifts in click-through rates, underperforming channels, or unexpected spend variances. This real-time anomaly detection ensures marketers are alerted to issues or opportunities as soon as they emerge, rather than after the fact.
Beyond monitoring, TapClicks leverages predictive analytics to help users anticipate what’s next. The platform can forecast future outcomes, benchmark KPIs against industry standards, and recommend budget reallocations or campaign optimizations—turning marketing intelligence automation into a true driver of ROI. Automated recommendations are presented directly within dashboards and can be delivered via SmartEmail summaries, keeping both internal teams and clients informed with concise, AI-curated updates.
By automating the heavy lifting of data analysis, TapClicks empowers marketers to focus on strategy and creative execution—confident that their KPI dashboards are always surfacing the most important insights. For a deeper dive into how these capabilities accelerate ROI tracking and visualization, explore "Digital Marketing KPI Dashboard: Visualize Metrics & ROI Fast".
See Everything, Everywhere: Effortless Cross-Channel Performance Tracking
Today’s marketers are expected to manage campaigns across social, search, programmatic, email, and more. But with all that data spread across dozens of platforms, how do you get a single, unified view of results? That’s where TapClicks steps in—breaking down data silos, connecting every touchpoint, and making it simple to see what’s working (and what’s not) across your entire marketing ecosystem.
Instantly Connect Every Marketing Channel
With TapClicks, you can harness over 10,000 marketing, advertising, and business data sources via robust Smart Connectors:
- Google Ads, Facebook, Instagram, LinkedIn
- Programmatic DSPs and ad servers
- Email platforms, SEO tools, CRM data
- Even offline media buys and custom data feeds
No channel gets left behind. Every campaign, every touchpoint—all in one place.
What Can You Do with Unified Data?
- Monitor attribution, engagement, and spend across every platform, from digital to traditional media.
- Eliminate blind spots that come from fragmented reporting tools.
- Track ROI and performance holistically, not just channel by channel.
Build Dashboards Your Way
Visualization is where the magic really happens. TapClicks puts powerful, customizable tools at your fingertips:
- Drag-and-drop widgets: Build dashboards perfectly tailored to your KPIs.
- Automated, branded charts and reports: Impress clients and stakeholders with clarity and polish.
- Interactive graphs and tables: Filter, drill down, and slice the data any way you want.
- Advanced filtering: Segment results by channel, audience, budget, location, and more.
Effortless Rollups for Agencies & Multi-Location Brands
Managing dozens (or hundreds) of clients or locations? TapClicks makes it easy:
| Feature | Benefit |
|---|---|
| Multi-location rollups | Aggregate and compare results across franchises, stores, or branches |
| Multi-client dashboards | High-level overviews for execs, detailed views for account teams |
| Granular drill-downs | Jump from big-picture trends to account-level details in a click |
From Scattered Metrics to Actionable Stories
By unifying and visualizing data across channels, TapClicks turns disconnected stats into clear, actionable narratives. That means:
- Faster, smarter decisions at every level
- Streamlined reporting for agencies and brands alike
- Confidence that you’re seeing the whole picture, every time
Want to see how a digital marketing KPI dashboard can accelerate your reporting and ROI tracking? Dive into TapClicks’ advanced tools and bring your marketing data to life.
Client Analytics Automation & Collaboration
Delivering timely, actionable insights to clients isn’t just a value-add—it’s a necessity for agencies and marketing service providers managing multiple accounts. TapClicks streamlines client analytics automation and collaboration with a suite of features designed for transparency, efficiency, and engagement.
First, TapClicks enables secure, client-facing dashboard sharing through customizable, role-based access controls. You can tailor what each client or stakeholder sees—granularly restricting views to specific channels, campaigns, or KPIs—ensuring each user experiences a dashboard relevant to their business needs. This not only builds trust but also empowers clients to self-serve detailed analytics, reducing back-and-forth requests for information.
Automated report scheduling takes the manual lift out of recurring communications. With TapClicks, agencies and brands can set up recurring, white-labeled report deliveries—daily, weekly, or monthly—directly to client inboxes. The SmartEmail feature elevates this further by automatically generating and sending AI-curated insight summaries alongside dashboards. These narratives highlight key performance trends, anomalies, and recommendations, making it easier for clients to understand what matters most—without digging through raw data.
Collaboration doesn’t stop at reporting. TapClicks’ workflow automation tools connect sales, operations, and account teams in a single platform. Tasks such as campaign order intake, approvals, and fulfillment are streamlined—ensuring all stakeholders are aligned and informed. This centralized approach reduces errors, speeds up campaign launches, and ultimately delivers a more cohesive client experience.
For agencies and brands managing at scale, these capabilities mean you can deliver consistent, high-value analytics and maintain client satisfaction—without the overhead of manual processes. To see how client analytics automation with TapClicks can transform your workflow, explore more on the TapClicks website or discover additional insights in Digital Marketing KPI Dashboard: Visualize Metrics & ROI Fast.
Measuring Results: From Campaign Performance Insights to ROI
Once your automated KPI reporting dashboard is up and running with TapClicks, the real value emerges in your ability to measure, optimize, and clearly communicate marketing outcomes. TapClicks transforms ongoing marketing intelligence automation into a powerful engine for driving results—empowering teams to benchmark KPIs, monitor budget pacing, and act on optimization recommendations with confidence.
Continuous Outcome Tracking and Marketing Intelligence
TapClicks enables marketers to move beyond static snapshots by delivering real-time, always-on tracking of campaign performance. With seamless data integration across 10,000+ sources, your dashboard aggregates everything from impressions and clicks to conversions and revenue, all in one place. This holistic view not only reduces manual effort but ensures you’re working with up-to-date, unified data for every channel, brand, or client.
KPI Benchmarking and Smart Budget Pacing
The platform’s AI capabilities make KPI benchmarking effortless. TapClicks analyzes historical and real-time data to set performance baselines, helping you identify what “good” looks like for each campaign or client. This allows you to instantly spot under- or over-performing initiatives. Built-in budget pacing tools track spend versus plan across all campaigns, providing early warnings if budget allocation veers off course—so you can proactively adjust strategies rather than react after the fact.
Optimization Recommendations for Data-Driven Decisions
What sets TapClicks apart is not just its ability to visualize data, but to interpret it. The AI reporting assistant surfaces actionable recommendations—such as reallocating budget to higher-performing channels or tweaking creative based on engagement patterns. These insights help teams move from descriptive analytics (“what happened?”) to prescriptive guidance (“what should we do next?”), ultimately driving stronger ROI.
Proven Efficiency and Smarter Decisions
Organizations using TapClicks consistently report dramatic improvements in reporting efficiency. By automating data pulls, report generation, and insight delivery, many teams reclaim 50+ hours per analyst per month. This frees up time for higher-value analysis and strategic planning. Agencies and brands alike benefit from faster, more accurate reporting cycles, leading to quicker optimizations and measurable business impact.
For a deeper dive into how automated dashboards accelerate ROI tracking and help visualize key metrics, check out "Digital Marketing KPI Dashboard: Visualize Metrics & ROI Fast".
Ultimately, TapClicks makes it possible to close the loop from campaign execution to ROI realization—empowering marketing teams to continuously improve, justify investments, and prove value with every campaign.
Choosing the Right Automated Reporting Solution
Selecting the ideal platform for automated KPI reporting dashboards can make or break your marketing operations. While the market offers a variety of options—including Funnel.io, Adverity, Agency Analytics, Datorama, Supermetrics, and NinjaCat—TapClicks stands apart for organizations that need unified scale, actionable AI insights, and seamless workflow automation.
Unlike “lightweight” dashboard tools or pure data connectors, TapClicks is a complete marketing operations platform. It uniquely combines end-to-end data integration, customizable dashboards, and AI-powered reporting within a single, scalable environment. With over 10,000 Smart Connectors, TapClicks centralizes multi-channel data from all your marketing, advertising, and business sources, eliminating fragmented analytics and the need for manual data stitching. This consolidation means agencies, brands, and enterprise teams can manage thousands of dashboards and clients without the bottlenecks common to point solutions.
TapClicks’ key differentiators include:
- Unified Scale: Built to handle massive reporting volumes for agencies, multi-location brands, and enterprise teams.
- AI Insights: Go beyond static dashboards—AI agents automatically surface campaign trends, budget pacing, and optimization recommendations, allowing teams to act on insights faster.
- Workflow Automation: Streamline operations from order management and client access to report generation and delivery, saving analysts 50+ hours per month.
- Data Flexibility: Use TapClicks as your single source of truth or feed cleaned, harmonized data into BI tools like Tableau, Power BI, or Looker.
When evaluating your next automated reporting solution, look for a platform that not only aggregates your data but also empowers your team with actionable intelligence and workflow efficiencies at scale. TapClicks delivers on all these fronts, making it the go-to choice for marketing organizations that demand both performance and flexibility.
Ready to see how TapClicks can transform your KPI reporting? Explore more or request a demo to get started.
Start Automating Your Marketing Data Today!
No Credit Card Required.

