

Automated KPI Reporting Dashboard: TapClicks AI Platform
Today’s marketing teams and agencies are juggling dozens of channels, campaigns, and client expectations. Manual reporting and fragmented tools can slow down decision-making and make it hard to spot what’s actually driving results. TapClicks solves this with a unified, AI-powered platform for automated KPI reporting dashboards—bringing marketing analytics automation, data visualization, and actionable campaign insights together in one place. This guide explores how TapClicks transforms marketing reporting, slashes manual workloads, and empowers teams to focus on strategy and growth.
Why Automated KPI Reporting Matters for Modern Marketers
In today’s fast-paced digital marketing landscape, teams are under relentless pressure to deliver measurable results across an ever-expanding array of channels. Yet, many marketers still find themselves bogged down by manual KPI reporting—scraping data from disparate platforms, wrangling spreadsheets, and struggling to produce timely, accurate performance snapshots. This not only drains valuable hours from analysts and account managers, but also increases the risk of errors, inconsistencies, and missed insights.
Manual reporting perpetuates data silos, making it difficult to piece together a holistic view of campaign success. When marketing analytics are scattered across disconnected tools, it’s nearly impossible to answer key questions quickly: Which channels are actually driving ROI? Where are budgets being wasted? What optimizations will have the biggest impact? The result is slow decision-making and reactive strategies, instead of proactive, growth-oriented management.
Automation fundamentally transforms this equation. By integrating, standardizing, and visualizing KPI data in real time, automated reporting platforms like TapClicks streamline workflows and free teams from repetitive data tasks. Errors are dramatically reduced as data flows seamlessly from source to dashboard, while insights surface instantly—enabling marketers to pivot campaigns, justify spend, and provide clients with up-to-the-minute reporting.
The business benefits are clear: faster, data-driven decisions; more time to focus on strategy and creative problem-solving; and stronger client relationships thanks to transparent, on-demand performance updates. In a competitive market, the difference between thriving and merely surviving often comes down to how quickly and accurately teams can turn marketing data into action. Automated KPI reporting isn’t just a convenience—it’s a strategic advantage for modern marketers.
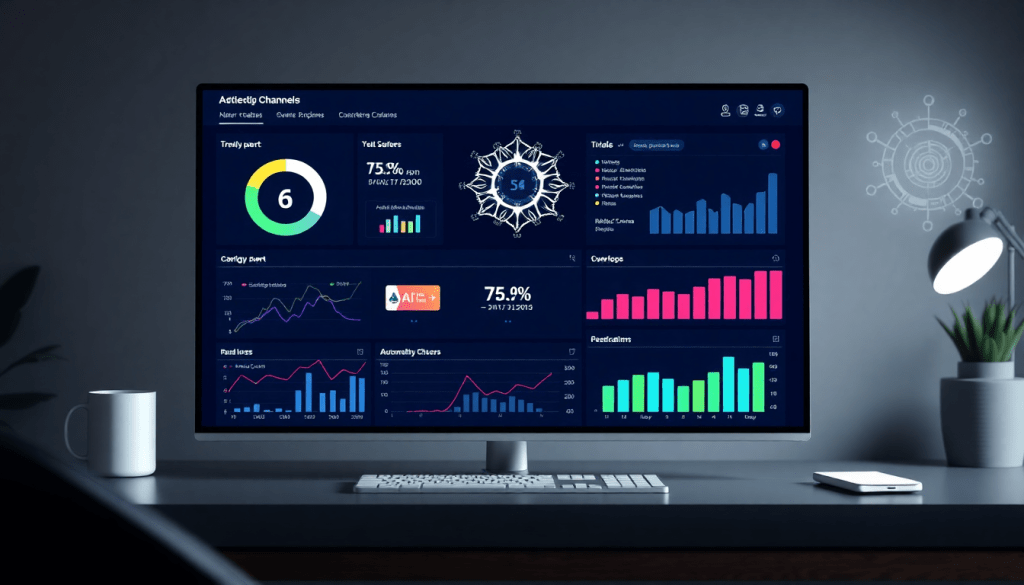
TapClicks AI Platform Overview
TapClicks is a comprehensive marketing operations platform designed to unify and automate every aspect of KPI reporting for agencies, brands, and enterprise teams. By consolidating marketing data, analytics, and workflow management into a single, scalable solution, TapClicks eliminates the need for fragmented tools and manual data wrangling. At the heart of its offering is an AI-powered reporting assistant that streamlines dashboard creation, automates complex reporting processes, and provides cross-channel performance tracking—all in one intuitive platform.
With TapClicks, users benefit from features like automated dashboard creation, which allows teams to quickly generate visual, client-ready reports from over 10,000 marketing, advertising, and business data sources. The platform’s drag-and-drop interface makes it easy to customize dashboards to match any brand’s look and feel, while AI-driven insights surface trends and optimization opportunities that might otherwise go unnoticed. Whether you’re looking to boost agency efficiency or deliver real-time performance metrics to stakeholders, TapClicks empowers teams to move beyond spreadsheets and manual reporting.
To learn more about how TapClicks automates marketing dashboard creation and drives agency reporting efficiency, check out their in-depth guide on marketing dashboard automation and agency reporting efficiency.
Automated Dashboard Creation: From Data Chaos to Clarity
Managing dozens—or even hundreds—of campaigns across multiple platforms can quickly turn reporting into chaos. TapClicks turns this challenge into a streamlined, automated process.
Why Manual Dashboards Fall Short
- Time-consuming: Manual data pulls, spreadsheet wrangling, and screenshot stitching drain valuable hours.
- Risk of errors: Human mistakes creep in when aggregating from multiple sources.
- Inconsistent branding: Visuals and reports often lack a cohesive, professional look.
How TapClicks Transforms Dashboard Creation
With TapClicks, your team can:
- Connect to 10,000+ data sources: Instantly pull in marketing, advertising, and business data—no IT intervention required.
- Use drag-and-drop tools: Build visually compelling, branded dashboards with just a few clicks.
- Customize for every audience: Tailor metrics and visualizations for each client, stakeholder, or campaign.
- Maintain up-to-date data: Automation ensures dashboards always reflect the latest performance, eliminating data lag.
- Save time: Analysts can reclaim 50+ hours per month previously lost to manual reporting.
| Manual Reporting | TapClicks Automated Dashboards |
|---|---|
| Copy/paste data | Automated data integration |
| Spreadsheet chaos | Centralized, unified platform |
| Error-prone | Consistent, accurate reporting |
| Time-intensive | 1-click dashboard creation |
| Unbranded visuals | Custom, branded dashboards |
A Look Inside the TapClicks Reporting Studio
- Drag-and-drop interface: No coding needed; assemble dashboards in minutes.
- Branded templates: Apply your agency or brand’s visual identity.
- Real-time updates: Data refreshes automatically, so reports are always current.
- Automated scheduling: Send recurring reports to clients and executives without lifting a finger.
The Bottom Line
TapClicks doesn’t just make dashboards easier—it makes them smarter and more impactful. Instead of wrestling with data, your team can focus on delivering insights that drive growth and ROI.
Ready to see how effortless reporting can be? Visualize metrics and ROI fast with digital marketing KPI dashboards.
Cross-Channel Performance Tracking & Data Integration
In a world where marketing happens everywhere—search, social, programmatic, OTT, email, and beyond—true insight demands a unified view. Siloed data makes it difficult to compare results, identify trends, or measure ROI holistically. That’s why connecting every marketing and advertising channel in a single dashboard isn’t just a convenience; it’s a competitive advantage.
TapClicks excels at this with a robust suite of automated data integration tools designed for scale. With over 10,000 marketing, advertising, and business data connectors, TapClicks makes it effortless to aggregate campaign metrics from virtually any source—Google Ads, Facebook, LinkedIn, programmatic platforms, SEO tools, CRMs, offline channels, and more—into one consolidated reporting environment.
The platform’s automated ETL/ELT (Extract, Transform, Load/Extract, Load, Transform) pipeline does the heavy lifting behind the scenes. Data is pulled in automatically, mapped, and normalized using TapClicks’ enrichment tools. This means marketers can blend and compare performance across channels, brands, locations, or clients—without manual downloads, spreadsheet wrangling, or custom scripts.
For agencies and media companies managing hundreds of clients, or brands running campaigns across dozens (or hundreds) of locations, TapClicks offers enterprise-grade multi-client and multi-location analytics. Each dashboard can be customized to show local, regional, or global rollups; stakeholders see only what’s relevant to them, with secure, role-based access.
What sets TapClicks apart is not just the breadth of its data connectivity, but the way it brings everything together for actionable, cross-channel performance tracking. Teams can quickly visualize which campaigns drive results, identify underperforming channels, or spot budget inefficiencies—turning data chaos into clarity and fueling smarter, faster decisions.
Learn more about how streamlined data visualization and KPI dashboards accelerate ROI analysis in this in-depth guide, or explore TapClicks’ full capabilities at tapclicks.com.
AI-Driven Reporting: Insights Without the Guesswork
TapClicks redefines what marketers can expect from reporting by making AI part of the process from the start. Instead of simply displaying data, the TapClicks AI reporting assistant actively monitors your campaigns, pulling out meaningful trends and insights so your team can move from “What happened?” to “What should we do next?”
What Makes TapClicks AI Reporting Different?
Here’s how TapClicks elevates the reporting experience:
-
Proactive Insights:
The AI assistant automatically highlights:- Key performance trends
- Unexpected anomalies (good or bad)
- New opportunities across all connected channels
-
SmartEmail: Insights Delivered Where They Matter
No more sifting through endless dashboards. With SmartEmail:- AI-curated summaries are sent straight to stakeholders’ inboxes
- Updates are timely, actionable, and written in plain language
- Stakeholders always have the latest campaign intelligence at their fingertips
-
Predictive Modeling for Smarter Decisions
TapClicks AI doesn’t just look back—it looks ahead. Predictive tools:- Analyze historical and real-time data
- Benchmark against industry standards
- Surface recommendations for optimization and budget pacing
- Flag campaigns at risk of underperforming so you can act before it’s too late
Why Marketers Love TapClicks AI
- Less Time Crunching Numbers:
Automated insights free up hours every week—no more manual deep-dives. - Proactive, Not Reactive:
Teams shift from simply reporting on the past to actively optimizing for the future. - Actionable Next Steps:
Recommendations are clear, prioritized, and ready to implement.
Ready to see AI-powered reporting in action?
Discover how real-time analytics and automation are changing the game in our in-depth guide on leveraging AI tools for smarter reporting.
Customization, Visualization, and Client Analytics Automation
One of TapClicks’ standout strengths is its ability to deliver fully customizable dashboards and reporting experiences—tailored precisely for any audience, whether it’s clients, executives, or internal marketing teams. With an intuitive drag-and-drop interface, marketers can create branded dashboards that not only look professional but also highlight the exact KPIs and insights that matter most to each stakeholder.
TapClicks supports deep levels of customization, enabling agencies and brands to white-label every report and dashboard with their own logos, color schemes, and messaging. This ensures that every touchpoint reinforces your brand identity, whether reports are shared internally or delivered directly to clients. Role-based access controls allow you to set granular permissions, so each user—be it a client, regional manager, or analyst—sees only the data and dashboards relevant to them. This keeps sensitive information secure and user experiences streamlined.
Automated scheduling takes the manual effort out of reporting entirely. With TapClicks, you can set up recurring delivery of dashboards and reports, ensuring that clients and teams always receive up-to-date analytics without lifting a finger. Whether you need daily executive summaries, weekly campaign performance updates, or monthly client reports, TapClicks handles the distribution—freeing up your team to focus on high-value strategy.
This flexible approach isn’t just about aesthetics or convenience. It’s designed for the unique operational needs of agencies juggling hundreds of clients, multi-location brands with complex hierarchies, and enterprise organizations demanding both granular and global insights. By automating analytics delivery and adapting the visualization for every audience, TapClicks helps you drive transparency, foster collaboration, and exceed client expectations—at scale.
To see how flexible dashboard customization and client analytics automation can transform your reporting workflow, visit TapClicks.
ROI Tracking Dashboard & Marketing Intelligence Automation
Tracking marketing ROI is notoriously challenging—especially when campaigns span multiple platforms, channels, and client accounts. TapClicks eliminates this complexity, giving marketers a clear, accurate view of performance and return on investment across every initiative. With TapClicks, ROI tracking and attribution become seamless: all campaign data is unified and transformed in real time, so you always know which efforts are driving results.
At the core of this capability is TapClicks’ automated marketing dashboard, which aggregates spend, leads, conversions, and revenue from over 10,000 sources into a single, customizable interface. Whether you’re managing dozens of client campaigns or multi-location brand initiatives, TapClicks delivers roll-up and drill-down views that reveal true ROI at every level. Automated attribution models help marketers connect the dots between channels, budget allocations, and business outcomes—ensuring smarter, data-driven decisions.
Beyond just reporting, TapClicks empowers you with marketing intelligence automation. The platform’s AI-driven insights surface high-performing campaigns, flag underperforming tactics, and recommend budget optimizations—all without manual analysis. By consolidating campaign performance data and actionable recommendations in one place, TapClicks becomes your single source of truth for marketing intelligence. This not only streamlines client reporting but also drives strategic planning, enabling teams to confidently reallocate budgets and maximize impact.
To learn more about how automated dashboards accelerate marketing ROI analysis and support smarter strategy, explore visualizing metrics and ROI fast with digital marketing KPI dashboards. With TapClicks, transforming campaign data into clear, actionable intelligence is finally within reach. For a complete overview of the platform’s capabilities, visit TapClicks.
Getting Started with TapClicks Automated KPI Reporting
Ready to break free from manual spreadsheets and fragmented reporting? TapClicks makes onboarding seamless, so you can quickly move from data chaos to actionable insights with automated KPI dashboards. Here’s how to get started:
1. Connect Your Data Sources
Begin by integrating all your marketing, advertising, and business platforms with TapClicks. With over 10,000+ pre-built connectors—including Google Ads, Facebook, LinkedIn, programmatic platforms, CRMs, and more—you simply authenticate your accounts and let TapClicks’ automated ETL/ELT pipeline extract, clean, and blend your data. This ensures your dashboards are always powered by up-to-date, unified datasets.
2. Customize Your Dashboards
Leverage TapClicks’ intuitive drag-and-drop dashboard builder to tailor reports for every audience—clients, executives, or internal teams. Choose from a range of visualizations, set up branded themes, and create data views that highlight your most important KPIs. TapClicks’ reporting studio lets you build templates once and reuse them across multiple clients or campaigns, ensuring consistency and saving time.
3. Automate Reporting and Insights Delivery
Set your dashboards and reports on autopilot. With TapClicks, you can schedule automated report delivery—daily, weekly, or monthly—directly to stakeholders’ inboxes. Use the AI-powered SmartEmail feature to receive curated insight summaries and optimization recommendations, so your team and clients are always in the loop with minimal manual effort.
4. Explore Resources and Support
TapClicks offers a wealth of resources to help new users hit the ground running. Access in-depth tutorials, webinars, and knowledge base articles, or schedule a personalized demo for hands-on guidance. The platform’s onboarding specialists and customer support team are always ready to help you unlock the full potential of automated KPI reporting.
5. Optimize and Scale
As your needs evolve, TapClicks scales with you. Expand to new data sources, add more users, or automate additional workflows—all while maintaining enterprise-grade security and governance. With built-in AI agents and customizable analytics, you can continuously refine your reporting process and drive smarter, faster decisions.
Ready to see how TapClicks can transform your marketing operations? Request a demo or explore the platform to start automating your KPI reporting and take your analytics to the next level.
Start Automating Your Marketing Data Today!
No Credit Card Required.

