

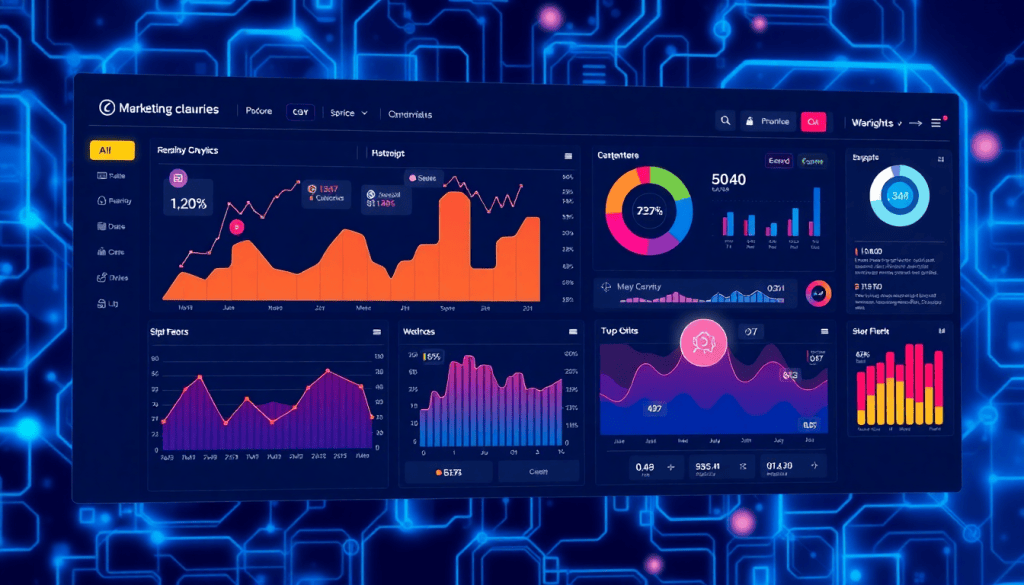
Automated KPI Reporting Dashboard: TapClicks AI Platform
Fast, reliable access to actionable marketing performance data can transform how agencies, brands, and enterprise teams make decisions. TapClicks’ automated KPI reporting dashboard combines deep data integration, AI-driven insights, and intuitive visualization to automate marketing analytics from start to finish. In this guide, discover how TapClicks streamlines KPI tracking, reporting, and campaign intelligence—reducing manual work and helping teams focus on strategy, not spreadsheets.
Why Automate Marketing KPI Reporting?
Manual marketing reporting creates roadblocks for teams—slowing down insights, introducing errors, and soaking up valuable time. But with automation, you can unlock a new level of efficiency and data confidence.
The Pain Points of Manual Reporting
Let’s break down what makes manual reporting such a challenge:
- Time-consuming: Hours lost downloading, copying, and reformatting data from multiple sources.
- Error-prone: Increased risk of mistakes like copy-paste slip-ups, outdated numbers, or missing data points.
- Fragmented: Data remains siloed in spreadsheets and disparate platforms, making it tough to get a holistic view.
- Delayed insights: Real-time performance tracking? Not possible when reports take days to build.
How Automation Solves the Problem
Automating your KPI reporting brings real, tangible improvements:
-
Eliminates Repetitive Tasks
- No more manual data pulls or spreadsheet merges.
- Routine reporting happens in the background—freeing your team for higher-level strategy.
-
Reduces Human Error
- Automated workflows ensure accuracy and consistency, minimizing the risk of costly mistakes.
-
Delivers Real-Time Metrics
- Dashboards update instantly with the latest campaign data.
- Teams and clients always see up-to-date results.
-
Improves Consistency
- Standardized reports across all clients, campaigns, and channels.
- Everyone measures success the same way—no confusion.
The Real-World Benefits for Agencies and Brands
Here’s what you can expect when you automate KPI reporting:
| Benefit | Impact |
|---|---|
| Faster Reporting Cycles | Get insights to stakeholders in minutes, not days. |
| Enhanced Data Accuracy | Reduce manual errors and boost trust in your numbers. |
| Real-Time Optimization | Spot issues or opportunities as they emerge—not later. |
| Greater Productivity | Reclaim hours for creative and strategic work. |
| Stronger Client Results | Deliver proactive, data-driven recommendations. |
Ready to see automation in action?
Dive deeper into how dashboard automation empowers agencies to deliver better, faster reporting in our guide to marketing dashboard automation for agencies.
How TapClicks Powers Automated KPI Reporting Dashboards
TapClicks redefines automated KPI reporting by seamlessly blending advanced data integration, intuitive dashboard creation, and AI-powered analytics—all within a single unified platform. At its core, TapClicks eliminates the complexity of connecting disparate marketing tools by supporting over 10,000 marketing, advertising, and business data connectors. This enables agencies, brands, and enterprise teams to bring campaign data from every channel—search, social, programmatic, CRM, and more—into one consolidated hub.
The platform’s automated ETL/ELT pipeline extracts, transforms, and loads data in real time, ensuring that every KPI dashboard reflects the most accurate, up-to-the-minute performance metrics. With TapClicks’ drag-and-drop dashboard builder, users can quickly create visually compelling, branded dashboards tailored for any audience—whether it’s a cross-channel summary for executives or granular campaign analytics for account managers.
What truly sets TapClicks apart is the built-in AI reporting assistant. This feature automatically analyzes imported data and dashboards to surface actionable insights, highlight trends, and suggest optimization opportunities without the need for manual number crunching. Automated dashboard creation further accelerates the reporting process, allowing teams to spin up new KPI dashboards with pre-configured widgets and templates that adapt to any vertical or campaign goal.
TapClicks also excels at cross-channel performance tracking. By blending and normalizing data across platforms, it empowers marketers to benchmark KPIs, compare results, and uncover deeper insights into what’s driving ROI—all from a single source of truth. This end-to-end automation not only reduces reporting workloads but also unlocks more time for strategic planning and campaign optimization.
To see how TapClicks can transform your marketing analytics, explore the TapClicks platform and experience the future of automated KPI reporting firsthand.
Key Features: From Data Integration to ROI Tracking
A truly automated KPI reporting dashboard must do more than pull numbers—it must unify fragmented marketing data, visualize results clearly, and make ROI tracking seamless. TapClicks excels here by providing a robust set of features that take marketers from data ingestion to actionable insights, all within a single platform.
10,000+ Data Connectors and Automated Pipelines:
TapClicks’ platform is built for scale, offering native integration with over 10,000 marketing, advertising, and business data sources. Whether you’re tracking Google Ads, Facebook, Salesforce, or niche ad networks, TapClicks automates the entire ETL (extract, transform, load) process. Data is imported, normalized, and enriched—no manual CSV uploads or spreadsheet wrangling required. With Smart Connectors, even custom or local data sources can be integrated, so your dashboards always reflect the full picture.
Marketing Data Visualization Tools:
Once your data is centralized, TapClicks’ drag-and-drop dashboard builder empowers teams to create visually compelling, easily digestible reports. Visualizations are fully customizable—choose from charts, tables, maps, and scorecards tailored to the KPIs that matter most. Each dashboard can be branded for clients or internal stakeholders and scheduled for automatic delivery, ensuring consistent, professional reporting without repetitive manual effort.
Built-in ROI Tracking and Customizable Analytics:
Tracking marketing ROI across campaigns, channels, and clients is effortless with TapClicks’ built-in analytics modules. The platform automatically calculates key performance indicators—like cost per acquisition, ROAS, and conversion rates—while giving users the flexibility to define their own custom metrics and formulas. Interactive filters and widgets allow teams to drill down by location, channel, or time period, supporting deep analysis and fast answers to executive questions.
With these features, TapClicks turns KPI reporting from a time-consuming chore into a strategic advantage—enabling teams to measure, optimize, and prove marketing impact with clarity and confidence.
AI Reporting Assistant: Actionable Insights at Scale
TapClicks’ AI reporting assistant is a game-changer for agencies and brands overwhelmed by the complexity and volume of marketing data. Built directly into the TapClicks platform, this intelligent agent continuously scans your dashboards and datasets, automatically surfacing the most important insights—without the need for time-consuming manual analysis.
Instead of simply visualizing raw data, TapClicks’ AI actively interprets campaign performance, highlighting trends, anomalies, and optimization opportunities. For example, the AI can flag underperforming channels, suggest budget reallocations, and even benchmark results against historical data or industry standards. These insights aren’t buried in spreadsheets; they’re delivered as clear, actionable recommendations within your reporting dashboards or directly to stakeholders’ inboxes via SmartEmail.
For agencies managing dozens or hundreds of client accounts, or for brands with multiple locations and channels, the TapClicks AI assistant scales effortlessly. It ensures every team member—from account managers to executives—gets relevant, up-to-the-minute intelligence tailored to their portfolio. This not only reduces the time analysts spend on routine reporting but also elevates the quality of decision-making across the organization.
Ultimately, TapClicks’ AI insights empower marketing teams to move from reactive reporting to proactive optimization. By automating the “heavy lifting” of analysis, TapClicks frees up your experts to focus on strategy and creative problem-solving—delivering measurable results for clients and stakeholders. To see how TapClicks can level up your reporting and campaign intelligence, explore more at TapClicks.
Cross-Channel Performance Tracking Made Easy
In today’s fragmented marketing landscape, measuring performance across paid, owned, and earned channels is essential—but it’s also incredibly complex. TapClicks simplifies this challenge by unifying all your channel data within a single, automated dashboard. Whether you’re tracking Google Ads, Facebook campaigns, website analytics, email, or organic social, TapClicks brings everything together—eliminating the need for manual data stitching or toggling between tools.
With TapClicks, you can effortlessly compare KPIs across channels, benchmark campaign performance, and identify what’s working (or where course correction is needed) in real time. Built-in visualization tools allow you to break down silos and see the full picture—so you can analyze paid media ROI alongside SEO growth, or understand how social engagement influences lead generation, all from one intuitive interface.
The platform’s cross-channel analytics go beyond just data aggregation. TapClicks’ AI-powered insights engine digs into your unified data set to surface actionable recommendations—for example, flagging underperforming campaigns, suggesting budget reallocations, or highlighting emerging trends by location or channel. This empowers agencies and brands to optimize spend and strategies with confidence, backed by a holistic view of marketing performance.
For a deeper dive into how real-time analytics and AI tools accelerate cross-channel marketing intelligence, check out this detailed guide to marketing dashboard automation and AI. By centralizing all your performance data, TapClicks ensures you’re always one step ahead—ready to benchmark, optimize, and report on every channel in one seamless workflow.
Marketing Intelligence Automation for Agencies & Brands
Agencies and brands today face a daunting challenge: managing analytics and reporting workflows across countless campaigns, channels, and client accounts. TapClicks tackles this complexity head-on by automating the entire marketing intelligence process—from data aggregation to insight delivery. Instead of wrestling with spreadsheets or manually building reports, teams can rely on TapClicks to handle the heavy lifting.
Automated Client Analytics and Reporting Workflows
TapClicks streamlines the reporting lifecycle by unifying data from over 10,000 sources and automatically transforming it into ready-to-use dashboards and reports. Agencies can set up recurring, branded reports for each client or brand location, scheduled to deliver insights at the cadence that matters most. This automation not only eliminates repetitive manual tasks, but also ensures that every stakeholder receives consistent, up-to-date analytics without delay.
Collaboration Features and Role-Based Access
Effective marketing operations demand seamless collaboration—especially for agencies and distributed brand teams managing multiple stakeholders. TapClicks delivers robust role-based access controls, allowing team members, clients, and partners to view exactly what they need (and nothing more). Sales, operations, and fulfillment teams can work together within the same platform, tracking campaign progress, assigning tasks, and sharing insights without switching tools or risking data silos.
Scaling Insights Across Hundreds of Dashboards and Clients
As agencies and brands grow, so does the complexity of their reporting environment. TapClicks is engineered for scale, supporting thousands of dashboards, reports, and client accounts simultaneously. AI-driven insights—delivered via customizable dashboards, automated emails, or direct platform notifications—help teams identify trends, anomalies, and optimization opportunities across their entire book of business. Whether you serve ten clients or a thousand, TapClicks ensures that marketing intelligence is both manageable and actionable at every level.
For a closer look at how TapClicks automates these workflows and empowers agencies to streamline analytics, explore their marketing intelligence automation solutions.
Customization and Visualization: Dashboards That Drive Decisions
One of TapClicks’ greatest strengths lies in its unrivaled flexibility for building dashboards that are as unique as your business. With a true drag-and-drop dashboard creation experience and a comprehensive branded reporting studio, TapClicks empowers agencies, brands, and enterprise teams to transform raw data into compelling, easy-to-understand visual stories.
Building a dashboard is effortless: users can select from a vast library of widgets and modules to visualize KPIs, trends, and campaign performance in the formats that matter most—charts, tables, maps, and more. Whether you’re creating a high-level executive overview or a granular, channel-by-channel breakdown for a specific client, every dashboard can be fully customized to highlight the metrics that drive impact.
The TapClicks reporting studio ensures every report and dashboard aligns with your brand or your clients’ branding guidelines. Add custom logos, color palettes, and templates to create a consistent, professional look for every stakeholder. These visualizations aren’t just attractive—they’re actionable, designed to surface insights at a glance so teams can pivot strategy with confidence.
Customization doesn’t stop at appearance. TapClicks allows users to set up dashboards tailored to different audiences, whether it’s a CMO, client account manager, or analytics specialist. Role-based access ensures each stakeholder sees the most relevant data, with the option to drill down for deeper analysis when needed.
To further enhance decision-making, TapClicks’ AI-powered data visualization tools automatically surface key trends and anomalies. These smart visualizations transform complex datasets into digestible, story-driven insights, helping teams not just report on results, but understand them in context.
With TapClicks, customization and visualization aren’t just features—they’re the foundation for data-driven decision-making at scale. Discover how you can create dashboards that not only inform, but inspire action by exploring more at TapClicks.
Kickstart Your Automated KPI Dashboards in TapClicks
Launching automated KPI reporting with TapClicks is simple, fast, and designed for immediate impact—so you can spend less time on manual tasks and more time driving results. Here’s how to get started:
1. Connect All Your Data (No More Spreadsheet Chasing)
- Plug in your sources: TapClicks supports 10,000+ connectors, including:
- Google Ads, Facebook, LinkedIn
- Programmatic ad platforms
- CRMs and business systems
- Automated ETL/ELT: TapClicks extracts, transforms, and loads your data, unifying everything in one place.
- Instant normalization: Say goodbye to data wrangling and last-minute number crunching.
2. Build Dashboards That Work for You
- Drag, drop, done: Use the intuitive dashboard builder to highlight the KPIs that matter—channel spend, leads, ROI, engagement, and more.
- Pick a template (or start fresh): Choose from prebuilt layouts or create custom dashboards for clients, brands, or leadership.
- Smart visualizations: Add charts, tables, and filters for easy, actionable analysis.
3. Automate Your Reporting & Delivery
- Hands-free scheduling: Set up automated delivery of branded reports—daily, weekly, or monthly.
- Share with anyone: Select which dashboards to send, and TapClicks delivers them straight to stakeholders’ inboxes.
- Always up-to-date: Eliminate manual exports and ensure clients always get the freshest insights.
Setting Yourself Up for KPI Success
Keep these habits in mind to maximize the value of your TapClicks dashboards:
- Clarify your goals: Decide which KPIs truly move the needle for your business or clients.
- Embrace automation: Let TapClicks handle recurring tasks so your team can focus on strategy.
- Iterate and improve: Use stakeholder feedback to refine KPIs, layouts, and reporting frequency.
| Step | What You’ll Achieve |
|---|---|
| Connect Your Data | Unified, always-on data source—no more silos or manual pulls |
| Build Dashboards | Custom, client-ready views tailored to your KPIs |
| Automate Reporting | Zero-effort, on-time delivery to every stakeholder |
Ready to see the difference?
Discover how TapClicks transforms analytics, collaboration, and marketing intelligence at tapclicks.com.
With TapClicks, your dashboards do the heavy lifting—so your team can focus on what matters most.
Start Automating Your Marketing Data Today!
No Credit Card Required.

