

Automated KPI Reporting Dashboard: TapClicks AI Platform
TapClicks delivers a unified solution for marketing teams and agencies looking to automate KPI reporting, streamline data collection, and turn campaign results into actionable insights. The TapClicks AI platform stands out with automated dashboard creation, cross-channel performance tracking, and intelligent analytics—all designed to save hours on reporting and provide a clear view of marketing ROI. Whether you're handling multiple clients or overseeing complex campaigns, TapClicks connects your data, visualizes key performance indicators, and empowers you to make smarter marketing decisions with less manual effort.
The Need for Automated KPI Reporting in Modern Marketing
Today’s marketing landscape is defined by complexity, speed, and relentless data growth. For agencies and in-house teams alike, manually tracking and reporting key performance indicators (KPIs) has become a daunting challenge. Marketers juggle dozens of platforms and campaigns—each with its own siloed data and reporting requirements. As a result, teams often spend countless hours consolidating spreadsheets, copy-pasting metrics, and double-checking for errors, only to deliver reports that are already outdated by the time they reach stakeholders.
This manual approach introduces several critical pain points. Data fragmentation makes it difficult to see a unified picture of campaign performance, while reporting delays can mean missed opportunities for optimization. Human error—whether in data entry, calculation, or interpretation—further undermines trust in the numbers and can lead to costly mistakes. In high-volume, fast-paced environments, these issues multiply quickly, draining resources and impacting client satisfaction.
That’s why automation in marketing analytics is no longer a luxury—it’s a necessity. By streamlining KPI reporting and automating repetitive tasks, agencies and enterprise teams unlock faster access to insights, reduce operational risk, and free up valuable analyst time for strategic work. Automated dashboards and reporting tools don't just accelerate delivery; they provide a single source of truth, so everyone works from the same, up-to-date data.
Embracing automation transforms agency workflows and empowers marketers to focus on what matters most: understanding performance and driving results. For a closer look at how dashboard automation boosts agency reporting efficiency, check out this in-depth article on marketing dashboard automation.
How TapClicks Automates Dashboard Creation
TapClicks streamlines the entire dashboard creation process, enabling marketing teams and agencies to build robust, automated KPI reporting dashboards with just a few clicks. The platform’s user-friendly interface guides users through connecting data sources—whether it’s Google Ads, Facebook, Salesforce, HubSpot, or one of the 10,000+ available integrations—requiring minimal setup and no coding expertise. Once connected, TapClicks automatically ingests, blends, and normalizes data from disparate systems, eliminating manual data wrangling and reducing the risk of errors.
Customization is at the heart of TapClicks’ dashboard creation. Users can tailor dashboards to specific clients, brands, or campaigns by selecting relevant KPIs, choosing from a library of visualization widgets, and applying unique branding or access controls. For agencies managing multiple clients or enterprise teams overseeing diverse product lines, dashboards can be cloned, adapted, and scheduled at scale, ensuring consistency while meeting individual reporting needs.
A typical streamlined workflow within TapClicks might involve a team connecting their paid media, SEO, and CRM data; selecting a dashboard template; then customizing the view for each client or campaign. Automated scheduling ensures that all stakeholders receive up-to-date reports without manual intervention. This end-to-end automation means marketing analysts spend less time on repetitive reporting tasks and more time analyzing insights and driving strategy.
With TapClicks, automated dashboard creation isn’t just about saving time—it’s about delivering consistent, professional, and actionable reporting at scale. Explore more about TapClicks’ capabilities and how it can transform your reporting workflow at TapClicks.com.
AI Reporting Assistant: Transforming Data into Action
Manually sifting through marketing data is tedious, error-prone, and slow—especially when you’re juggling dozens of channels and hundreds of campaigns. TapClicks’ AI-powered reporting assistant changes the game, making it easy to move from raw data to real insights.
Why Manual Analysis Is Holding You Back
- Time-consuming: Scanning endless dashboards and spreadsheets eats up hours every week.
- Easy to miss opportunities: Human oversight can overlook subtle trends or early warning signs.
- Complexity: Building custom formulas and queries requires technical expertise not every marketer has.
What TapClicks’ AI Reporting Assistant Does for You
With advanced machine learning and natural language processing, TapClicks’ AI continuously monitors your data to uncover what matters most—no coding or data science required.
Here’s how it works:
- Continuous Data Scanning
- Monitors all your dashboards, campaign metrics, and performance streams.
- Instant Insight Generation
- Flags spikes, drops, anomalies, and optimization opportunities.
- Highlights underperforming channels, budget pacing issues, and conversion rate jumps.
- Actionable Alerts & Recommendations
- Surfaces the “why” behind performance shifts, not just the “what.”
- Prioritizes findings so you know where to focus.
SmartEmail: Insights Delivered Where You Need Them
A standout TapClicks feature, SmartEmail, takes insights a step further:
- AI-generated summaries: Get concise, plain-language briefs about what’s happening in your campaigns.
- Automated delivery: Summaries go straight to your inbox—or your clients’—so no one misses a beat.
- Actionable recommendations: Not just “what happened,” but what to do next.
The Payoff: More Time, Less Risk, Better Results
- ✅ Save hours: Analysts reclaim time previously lost to manual reporting.
- ✅ Reduce errors: Fewer manual touchpoints means less chance of mistakes.
- ✅ Accelerate strategy: Free your team to focus on high-impact optimization, not data wrangling.
Unlock Your Competitive Edge
With TapClicks, agencies and enterprise marketers get actionable intelligence—fast. No more waiting on end-of-month reports or building dashboards from scratch. The insights are there when you need them, driving better performance and smarter decisions, every day.
Ready to see what AI-powered reporting can do for you?
Learn more about TapClicks.
Cross-Channel Performance Tracking Made Simple
In today’s marketing landscape, campaigns rarely live in a single channel—success depends on orchestrating paid, owned, and earned media across dozens of platforms. TapClicks simplifies the complexity by centralizing all your marketing data within one intuitive dashboard. Whether you’re tracking PPC campaigns, social engagement, organic traffic, or email performance, TapClicks automatically pulls data from over 10,000 marketing, advertising, and business sources, ensuring every channel is represented and up-to-date.
This unified approach to data management means you no longer need to juggle spreadsheets or manually cross-reference reports from fragmented systems. By blending and normalizing data across platforms, TapClicks enables true apples-to-apples KPI comparisons—so you can accurately measure the impact of each channel and see how they work together to drive results. This level of cross-channel performance tracking is essential for holistic campaign measurement, revealing attribution paths, budget pacing, and channel synergies that might otherwise go unnoticed.
For marketers and agencies managing multi-channel campaigns or multiple clients, TapClicks’ cross-channel dashboards provide a single source of truth. You can quickly identify which channels are outperforming, where optimizations are needed, and how your marketing investments are translating into real ROI. To see how visualizing blended metrics can accelerate your understanding of campaign performance and ROI, explore this guide on visualizing metrics and ROI with digital marketing KPI dashboards. With TapClicks, cross-channel reporting isn’t just easier—it’s smarter, giving you the clarity and control to optimize every aspect of your marketing strategy.
Visualizing Marketing Data for Better Client Communication
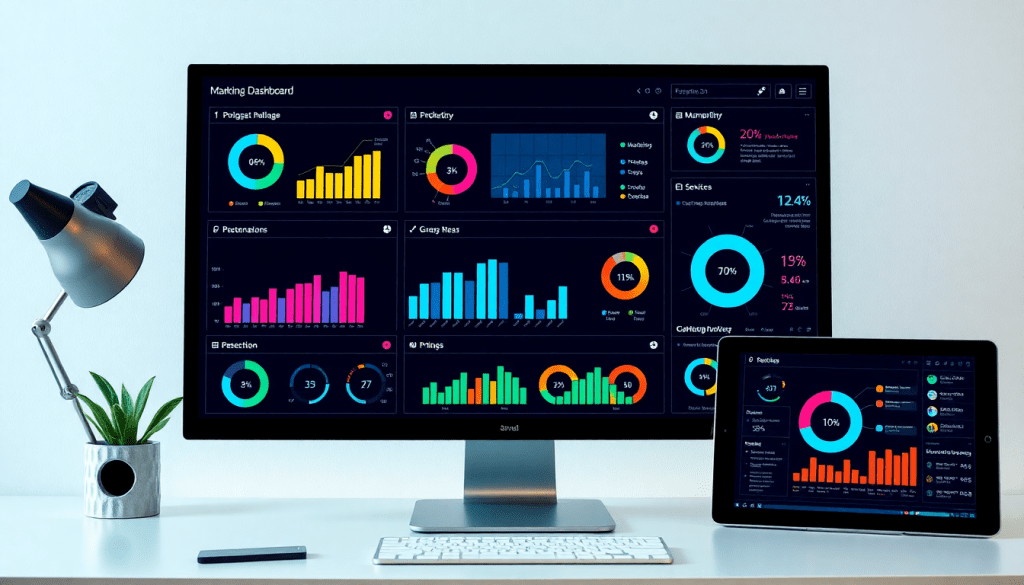
One of the most powerful features of TapClicks is its ability to transform complex marketing data into clear, actionable visuals that enhance communication with clients and stakeholders. Through intuitive dashboards, interactive charts, and automated scheduled reports, TapClicks helps agencies and marketing teams present campaign results in a way that’s both compelling and easy to understand.
Dashboards and Charts: TapClicks offers a robust suite of data visualization tools, allowing users to create custom dashboards tailored to each client’s needs. Drag-and-drop widgets make it effortless to showcase KPIs across channels, while a variety of chart types—including line graphs, bar charts, and pie charts—bring data stories to life. These visuals can be branded with client logos, custom color schemes, and specific messaging, ensuring every report aligns with your agency or client’s identity.
Automated, Transparent Reporting: With TapClicks, you can schedule reports to be automatically generated and delivered to clients at regular intervals. This automation not only saves valuable time but also builds transparency and trust, as clients receive consistent, up-to-date insights on campaign progress. Scheduled reports can be customized to highlight the metrics that matter most to each stakeholder, whether that’s lead generation, ad spend, conversions, or ROI.
Best Practices for Customization: To maximize the impact of your visualizations, TapClicks enables best practices such as segmenting data by location, campaign, or channel, and tailoring visuals to reflect client-specific goals. For instance, agencies can create executive summary dashboards for C-level stakeholders, while providing granular breakdowns for marketing managers. This flexibility ensures every recipient gets the information they need, in the format they prefer.
Seamless Sharing and Scheduling: Sharing insights is simple with TapClicks. Reports and dashboards can be securely shared via email, PDF, or live dashboard links, allowing stakeholders to access real-time data whenever they need it. The platform’s role-based permissions ensure that clients see only the data that’s relevant to them, further enhancing trust and collaboration.
By leveraging TapClicks’ marketing data visualization features, agencies and brands can elevate their client communications—turning raw data into powerful stories that demonstrate value, foster transparency, and drive better marketing outcomes. To see these visualization capabilities in action, explore more at TapClicks.
ROI Tracking Dashboard: Proving Campaign Value
In today’s results-driven marketing landscape, demonstrating clear return on investment (ROI) is essential for both agencies and brands. ROI tracking dashboards have become a must-have—providing instant clarity on what’s working, where budgets are going, and how campaigns contribute to bottom-line goals. TapClicks automates ROI calculation and visualization, empowering marketers to confidently prove value, optimize spend, and strengthen client relationships.
With TapClicks, ROI tracking isn’t limited to a single channel or campaign. The platform seamlessly aggregates data from paid, owned, and earned media, normalizing metrics across sources for a unified view of performance. Users can easily connect their ad platforms, CRM, web analytics, and sales data, allowing TapClicks to automate the entire ROI calculation process. From the moment data is ingested, TapClicks tracks key metrics such as ad spend, impressions, clicks, conversions, pipeline revenue, and closed sales—enabling real-time attribution of outcomes to specific campaigns and tactics.
For example, a digital agency managing multi-channel campaigns for several clients can instantly see which ad groups are driving the most qualified leads or highest sales, thanks to TapClicks’ automated dashboards. Detailed widgets can be configured to display critical ROI metrics like cost per acquisition (CPA), return on ad spend (ROAS), and revenue contribution by channel. The result is a living, breathing dashboard that updates automatically—no more manual data pulls, tedious spreadsheet calculations, or delayed reporting cycles.
TapClicks also supports practical budget optimization. By visualizing spend versus results in a single dashboard, marketers can identify underperforming channels and reallocate budgets on the fly. Built-in AI agents surface optimization opportunities, highlight trends, and make recommendations—ensuring that every dollar spent is working harder for your brand or clients.
Ultimately, the TapClicks ROI tracking dashboard empowers marketing teams to move from reactive reporting to proactive performance management. Agencies and brands gain a competitive edge by demonstrating transparent, data-driven value to stakeholders and making smarter, faster decisions about campaign strategy and budget allocation. To see how ROI dashboards can transform your marketing operations, explore more about TapClicks’ marketing operations platform.
Real-Time Insights and Marketing Intelligence Automation
In today’s fast-paced marketing environment, the ability to access and act on real-time data is a game-changer. TapClicks empowers marketing teams and agencies with real-time data refreshes across all connected channels, eliminating lag and ensuring that decision-makers always have the most current campaign information at their fingertips. This instant access to up-to-date metrics allows organizations to confidently adjust strategies, optimize campaigns, and respond to opportunities or issues as they arise—without waiting for manual data pulls or static reports.
Beyond just data freshness, TapClicks’ marketing intelligence automation drives continuous improvement by leveraging AI-powered agents that proactively analyze performance trends and surface actionable insights. Instead of spending hours sifting through dashboards or spreadsheets, users receive automated recommendations for optimization, budget pacing, and campaign adjustments. This shift from reactive to proactive analytics dramatically accelerates the path from data to decision, enabling marketing leaders to stay ahead of the competition.
For a deeper dive into how real-time analytics and reporting automation are transforming marketing strategy, check out this in-depth article on real-time insights and reporting automation. By integrating always-current data and AI-driven intelligence, TapClicks helps teams not only measure what’s happening now, but also predict what’s next—empowering smarter, faster, and more effective marketing at scale.
Why Choose TapClicks for Automated KPI Reporting?
Selecting the right platform for automated KPI reporting can make or break a marketing organization’s efficiency and strategic impact. TapClicks stands out as the marketing operations solution that not only automates the heavy lifting of data integration and dashboard creation but adds tremendous value through scale, AI-driven insights, and seamless workflow automation.
Unlike point solutions or basic reporting tools, TapClicks is purpose-built to handle the demands of agencies and enterprises managing hundreds—or even thousands—of campaigns and clients. Its robust data integration capabilities cover over 10,000 marketing, advertising, and business data sources, eliminating data silos and manual imports. With TapClicks’ automated ETL/ELT pipeline, users can effortlessly blend and normalize cross-channel datasets, ensuring every dashboard is accurate, current, and actionable.
What truly sets TapClicks apart is its AI-powered advantage. TapClicks doesn’t just visualize data; it proactively analyzes dashboards, surfaces actionable insights, and sends automated SmartEmail summaries to stakeholders. This means marketing teams spend less time sifting through reports and more time optimizing campaigns based on real intelligence—often saving 50+ hours per analyst each month.
Workflow automation is another TapClicks differentiator. Centralized order management, role-based access, and collaboration tools streamline processes across sales, operations, and fulfillment teams. Whether you’re an agency striving to scale reporting for hundreds of clients or a multi-location brand needing comprehensive oversight, TapClicks adapts to your workflow—rather than forcing you into rigid templates.
Compared to alternatives like Funnel.io, Adverity, or Agency Analytics, TapClicks offers unmatched scalability, deeper AI insights, and end-to-end workflow automation. While some competitors are lightweight or focus solely on data piping, TapClicks delivers a complete marketing operations platform designed to unify, optimize, and elevate your analytics.
Ready to see how TapClicks can transform your KPI reporting and marketing intelligence? Explore TapClicks or request a personalized demo to experience the platform’s automation and insights firsthand.
Start Automating Your Marketing Data Today!
No Credit Card Required.

