

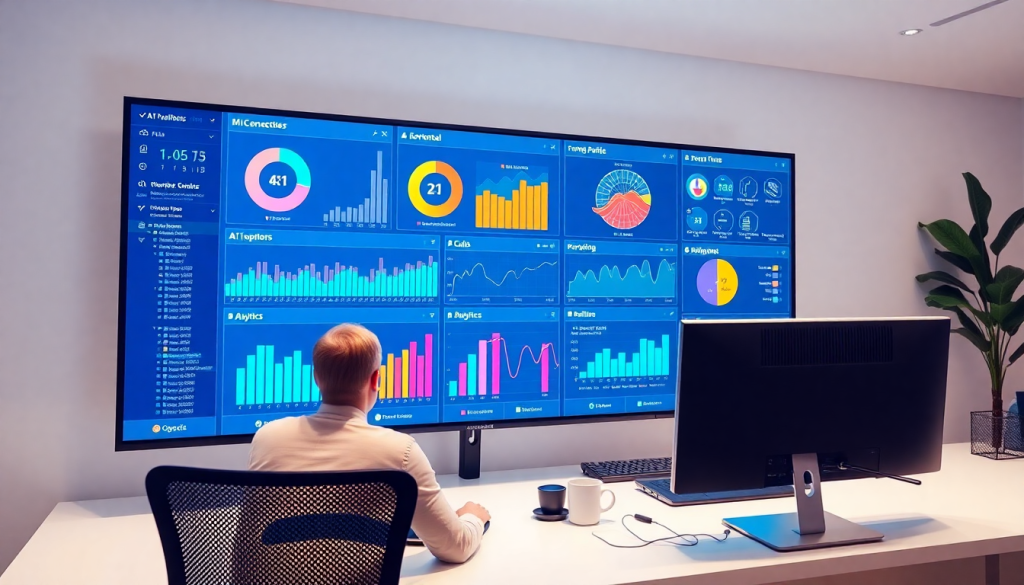
Automated KPI Reporting Dashboard: Real-Time Marketing Insights
Modern marketers are under more pressure than ever to deliver clear, actionable data—fast. An automated KPI reporting dashboard transforms how teams track performance, surface insights, and communicate results. With TapClicks, marketing KPI automation combines real-time analytics, AI-powered reporting, and seamless cross-channel visibility, turning complex campaign data into a single source of truth. This guide explores how automated dashboards empower better decisions, save time, and unlock deeper marketing insights for agencies, brands, and enterprise teams alike.
What is an Automated KPI Reporting Dashboard?
An automated KPI reporting dashboard is a centralized, real-time platform that collects, processes, and visualizes key marketing performance indicators (KPIs) without manual intervention. In the context of marketing analytics, its core purpose is to automate the tracking and reporting of metrics that matter most—such as impressions, click-through rates, conversions, and ROI—across multiple campaigns and channels.
Unlike manual reporting, which often relies on static spreadsheets and time-consuming data pulls from disparate sources, an automated dashboard continuously aggregates and updates data from all connected platforms. This ensures stakeholders always have access to the latest performance insights, eliminating delays and reducing the risk of human error.
Manual reporting typically requires marketers to log into separate ad accounts, export CSV files, and spend hours cleaning and compiling data before even beginning the analysis. This approach is not only tedious but also prone to inconsistencies and outdated information. In contrast, automated reporting platforms—like those offered by TapClicks—streamline this entire process. TapClicks integrates with over 10,000 marketing, advertising, and business data sources, pulling in campaign data automatically, normalizing it, and presenting it in customizable dashboards and branded reports.
With TapClicks, marketing teams can move beyond the limitations of manual reporting and embrace a unified, real-time view of their KPIs, enabling faster, more informed decision-making. This not only saves valuable time but also empowers agencies, brands, and enterprise teams to act on insights as soon as they emerge. To learn more about how TapClicks leads the way in reporting automation, visit TapClicks.
Why Marketing KPI Automation is Essential
Manual reporting methods—think static spreadsheets, endless copy-paste routines, and hours spent hunting down the latest campaign updates—simply can’t keep pace with today’s dynamic marketing landscape. These traditional processes are not only time-consuming and error-prone, but they also create bottlenecks, preventing teams from acting on the most current data.
Automated KPI reporting solves these challenges by delivering real-time, always-accurate performance snapshots without the manual labor. Marketers gain significant advantages:
- Speed and Agility: Automated dashboards pull in live data from every channel and platform, ensuring your team sees the latest results immediately. No more waiting for end-of-week updates—decisions can be made on the fly, keeping campaigns agile and responsive.
- Accuracy and Trust: Automation eliminates manual data entry errors, version control headaches, and reporting inconsistencies. Stakeholders get a single source of truth, building confidence in every metric and insight.
- Scalability: As marketing programs grow across more channels, campaigns, and clients, manual reporting quickly becomes unsustainable. Automation scales effortlessly, whether you’re managing five dashboards or five thousand.
- Time Savings: With tedious data pulls and report formatting out of the equation, analysts reclaim dozens of hours each month—time that can be redirected to strategy, analysis, and optimization.
Most importantly, automation empowers truly data-driven marketing. Teams can shift from reactive, rear-view reporting to proactive, strategic decision-making. Automated KPI dashboards spotlight trends, uncover issues as they emerge, and keep every stakeholder aligned on what matters most.
For a deeper dive into how real-time analytics and automation are revolutionizing marketing reporting, check out this overview on "real-time analytics and automation".
Key Features of a Real-Time Performance Dashboard
An effective real-time performance dashboard is the backbone of modern marketing analytics, enabling teams to move beyond static reports and manual data pulls. At its core, a best-in-class dashboard offers live data integration, customizable widgets, and interactive visualizations—empowering marketers to track performance as it happens and pivot quickly in response to trends.
Live Data Integration is arguably the most critical feature. Instead of waiting for end-of-week exports or coordinating with multiple data owners, a real-time dashboard like TapClicks connects directly to thousands of marketing, advertising, and business sources. This ensures that every metric—from impressions to conversions—is updated automatically, eliminating data lag and manual intervention.
Customizable Widgets allow users to tailor the dashboard to their unique needs. Whether you’re an agency tracking client campaigns or a brand managing multi-location performance, drag-and-drop modules make it easy to display the KPIs that matter most. For example, you might spotlight ad spend, click-through rates (CTR), cost per acquisition, or return on investment (ROI), all within a single view.
Interactive Visualizations transform raw numbers into actionable insights. With features like real-time trend graphs, heat maps, and filterable tables, teams can drill down from high-level overviews to granular details in seconds. This interactivity speeds up decision-making—users can instantly identify which channels are hitting targets, which creatives are underperforming, and where budget reallocations will have the most impact.
A real-time dashboard also supports instant performance monitoring, alerting marketers to anomalies or sudden shifts in campaign results. For example, if conversions unexpectedly spike or dip, the dashboard surfaces this change immediately, allowing teams to investigate and respond before it affects the bottom line.
Metrics Tracked in Real Time:
- Impressions and reach
- Clicks and click-through rates (CTR)
- Conversions and conversion rates
- Cost per click (CPC) and cost per acquisition (CPA)
- ROI and ROAS (Return on Ad Spend)
- Engagement metrics (likes, shares, comments, video views)
- Channel-specific KPIs (social, search, email, and display)
Ultimately, a real-time performance dashboard does more than just report on KPIs—it becomes a dynamic command center for marketing teams. By integrating live data, customizable layouts, and interactive analytics, platforms like TapClicks ensure that organizations can monitor, optimize, and communicate results faster and more effectively than ever before.
AI Analytics Reporting: Smarter Insights, Less Effort
AI analytics reporting is rapidly redefining the value marketers extract from their data dashboards. Within an automated KPI reporting dashboard, AI-driven technologies act as intelligent assistants—analyzing campaign data in real time, identifying patterns and anomalies, and surfacing actionable insights that would otherwise take hours (or days) to discover manually.
At its core, AI analytics reporting leverages machine learning algorithms to sift through vast volumes of marketing data, spotting trends and outliers across channels and campaigns. Instead of static charts or generic metrics, users receive dynamic recommendations—such as which campaigns are underperforming, where budgets are being wasted, or what adjustments could drive better results. This enables teams to move beyond “what happened” to “why it happened” and “what to do next.”
Anomaly detection is a standout feature: AI continuously monitors KPI fluctuations, instantly flagging unexpected spikes or drops in key metrics. This proactive alerting allows marketers to address issues or seize opportunities before they impact overall performance. Predictive recommendations go a step further, using historical data and pattern recognition to forecast future outcomes—such as likely conversion rates or optimal budget allocations.
TapClicks is a leader in integrating AI analytics into automated reporting workflows. The platform’s automated campaign insights deliver powerful, context-aware analysis directly inside your dashboard. With TapClicks AI Agents and SmartPilot, marketers can automate insight generation, receive campaign scoring and optimization guidance, and even schedule AI-curated email summaries for stakeholders. This not only saves countless analyst hours but also ensures that every reporting cycle delivers smarter, more strategic recommendations.
In short, AI analytics reporting transforms an automated KPI dashboard from a static reporting tool into an always-on marketing advisor—empowering teams to optimize performance, justify spend, and focus on strategy rather than data wrangling.
Tracking Automated Marketing Metrics Across Channels
One of the greatest challenges in modern marketing is consolidating analytics from a diverse array of channels—each with its own platforms, metrics, and data formats—into a coherent, actionable view. Marketers juggle paid campaigns (like Google Ads and Facebook), owned media (websites and email), and earned media (social shares and PR), but manual aggregation is error-prone and time-consuming. This fragmentation often leads to incomplete reporting, missed trends, and slower response times.
Automated KPI reporting dashboards solve this problem by unifying performance data from all your marketing channels into a single, always up-to-date interface. By leveraging robust integration capabilities, platforms like TapClicks pull in data from thousands of sources—ranging from search and social to display, programmatic, and email—automatically blending and normalizing disparate datasets for side-by-side comparison.
For example, imagine tracking impressions, click-through rates, and conversions across Google Ads, Meta, LinkedIn, and programmatic display, while also monitoring organic web traffic, email open rates, and influencer mentions. With an automated dashboard, you can see which channels are driving the most conversions or highest ROI, compare campaign effectiveness in real time, and quickly identify underperforming segments—without ever switching tabs or exporting CSVs.
This unified view empowers marketers to:
- Spot cross-channel trends: Instantly see how a spike in paid search clicks correlates with organic traffic or social engagement.
- Optimize budgets on the fly: Allocate spend toward channels showing real-time lift or better conversion rates.
- Deliver holistic reports: Provide clients and stakeholders with a complete picture of marketing performance, not just siloed snapshots.
Ultimately, automated dashboards transform cross-channel analytics from a daunting manual task into a streamlined, insight-rich process, giving teams the clarity and agility to adapt strategies and maximize impact across every marketing touchpoint.
Customization and Client KPI Reporting Tools: Making Every Report Your Own
Every marketing team is unique—so your reporting tools should be, too. Whether you need distinct branding, custom layouts, or precise control over who sees what, TapClicks gives you the power to make your dashboards and reports truly your own.
What Can You Customize with TapClicks?
With TapClicks, you can easily:
- Shape dashboard layouts to fit your workflow or your client’s priorities.
- Apply your brand’s color palette for a consistent look and feel.
- Add client or agency logos for seamless white-labeling—ideal for agencies with multiple clients.
- Choose from interactive dashboards or branded PDFs for any reporting need.
Who Sees What? Built-In Role-Based Access
Controlling data access is simple with TapClicks. Here’s how you can tailor visibility:
| Role/Team | What They See | Example Use Case |
|---|---|---|
| Sales Teams | High-level performance overviews | Quick campaign summaries for client calls |
| Fulfillment/Analytics | Granular, campaign-level data | In-depth optimizations and troubleshooting |
| Local Managers | Location-specific insights | Regional performance without cross-location exposure |
| Executives/Clients | Branded, top-line reports | Board meetings, client reviews |
Automating the KPI Reporting Workflow
Why spend hours building and sending reports? TapClicks automates it all:
- Set Up Once: Choose KPIs, visualization style, and delivery cadence.
- Automated Refresh: Data updates automatically—no manual pulls needed.
- Scheduled Delivery: Stakeholders get fresh data, delivered to their inboxes as dashboards or polished PDFs.
- White-Label Experience: Every report feels like an extension of your agency or brand.
The Big Wins for Agencies and Brands
- Save dozens of analyst hours per month
- Reduce manual errors and missed deadlines
- Impress clients with a premium, branded experience
- Scale without sacrificing personalization
Ready to see the difference? Explore TapClicks.
ROI Visualization and Data-Driven Decision Making
When marketers can clearly visualize return on investment (ROI) across campaigns, they gain the power to drive smarter decisions, justify spend, and optimize strategies with confidence. ROI visualization software, like that integrated into TapClicks, transforms raw performance data into intuitive charts, graphs, and dynamic dashboards. This clarity makes it easy to compare channel effectiveness, spot underperforming campaigns, and identify opportunities for budget reallocation—all in real time.
For agencies and brands, communicating marketing value to executives and clients is often a challenge. Dense spreadsheets and static reports can obscure the true impact of marketing efforts. By contrast, automated dashboards with interactive ROI visualizations provide stakeholders with an immediate, compelling view of campaign outcomes. TapClicks’ dashboards enable users to drill down by channel, campaign, or location, revealing granular insights while keeping the bigger picture in focus. This transparency not only builds trust but also fosters more productive, data-driven conversations about where to invest next.
The impact of clear ROI visualization goes beyond reporting—it enables data-driven decision making at every level. Marketers can instantly see how changes in spend affect bottom-line results, test new tactics with confidence, and respond to trends as they emerge. Whether it’s optimizing paid search, evaluating multi-channel campaigns, or demonstrating the value of digital transformation, ROI dashboards ensure that every decision is anchored in real, up-to-date data.
For a deeper dive into how real-time insights and ROI visualization with TapClicks can transform your marketing operations, check out this resource on real-time insights with TapClicks.
How TapClicks Streamlines Automated Analytics Workflows
TapClicks is purpose-built to make automated analytics workflows seamless, scalable, and truly actionable. The platform’s reporting automation ecosystem is designed to eliminate manual effort and empower marketing teams to focus on strategy and optimization—not data wrangling.
End-to-End Workflow Automation
The TapClicks journey begins with robust data integration. Using 10,000+ native connectors—spanning paid, owned, and earned channels—TapClicks’ Smart Connectors automatically pull campaign, spend, and performance data from virtually any source. This automated ETL/ELT process ensures that your data is always up to date, with enrichment and normalization tools that blend disparate datasets into a unified view. Whether you’re tracking across Google Ads, Facebook, programmatic display, email, or offline channels, TapClicks centralizes everything in a single, reliable source of truth.
Next, TapClicks’ intuitive dashboarding tools transform this harmonized data into highly customizable, interactive dashboards. Drag-and-drop widgets, branded templates, and flexible filtering put real-time insights at your fingertips—no coding required. Teams can quickly build dashboards tailored to executive, client, or channel-specific needs, ensuring the right metrics are always front and center.
Automated Reporting and AI Insights
Reporting is fully automated: scheduled reports and live dashboards can be delivered to internal stakeholders or clients on-demand, reducing repetitive work and ensuring everyone stays aligned. TapClicks goes beyond basic automation with AI-powered features like SmartPilot, which surfaces actionable insights, benchmarks, and optimization recommendations without manual analysis. AI Agents proactively scan your dashboards for anomalies and trends, while SmartEmail automatically summarizes key findings and pushes them to your inbox—enabling faster, smarter decisions.
Scalability and Seamless Integration
Designed for high-volume agencies, multi-location brands, and enterprise teams, TapClicks scales effortlessly to handle thousands of dashboards and reports at once. Role-based access controls and workflow automation streamline collaboration between sales, operations, and fulfillment teams. For organizations with existing analytics investments, TapClicks’ data can be piped directly into BI tools like Tableau, Power BI, and Looker, ensuring flexibility and compatibility with your broader data strategy.
Time Savings and Operational Impact
By automating data collection, transformation, dashboarding, and reporting, TapClicks routinely saves analysts 50+ hours per month—time that can be reinvested in campaign optimization and strategic planning. The result is a marketing operations platform that not only accelerates reporting but fundamentally enhances the ability to drive performance and prove ROI at scale.
To see how TapClicks can streamline your analytics workflows and supercharge your marketing operations, learn more about the platform.
Choosing the Right Data-Driven Marketing Dashboard Solution
Selecting the ideal automated KPI reporting dashboard is a mission-critical decision for any marketing leader aiming to scale, optimize, and future-proof their analytics infrastructure. To ensure the platform you choose will accelerate—not hinder—your marketing operations, consider these essential evaluation criteria:
Automated KPI Reporting Solution Checklist:
- Comprehensive Data Integration: Does the platform connect to all your marketing, advertising, and business data sources without cumbersome workarounds?
- Scalability: Can it handle your current reporting volume and grow with your team, clients, or locations?
- Real-Time and Automated Updates: Are dashboards and reports always up to date, with automated data refreshes and scheduled delivery?
- AI-Driven Insights: Does the solution surface actionable insights, predictive trends, and optimization recommendations automatically?
- Customization and Branding: Can you tailor dashboards to different roles, clients, or brands—including white-labeling?
- Workflow Automation: Does it streamline order management, approvals, and collaboration—not just reporting?
- BI/Tech Stack Flexibility: Can you use the platform as your single source of truth, or integrate clean data into other BI tools when needed?
- Security and Access Controls: Are there robust options for client access, role-based permissions, and data privacy?
TapClicks vs. Other Platforms: What Sets It Apart?
While many dashboard tools promise automation and integration, TapClicks stands out for its unified scale, AI-powered intelligence, and operational workflow capabilities. Competitors like Funnel.io and Supermetrics mainly serve as data pipelines, lacking TapClicks’ robust dashboarding and workflow tools. Lightweight options such as Agency Analytics or NinjaCat may work for small teams but struggle with high volumes or advanced analytics.
TapClicks uniquely combines:
- 10,000+ data connectors for true cross-channel analytics
- AI Agents that not only visualize but also interpret and recommend actions
- Centralized workflow and order management so teams can collaborate seamlessly
- Flexible deployment—use TapClicks as your marketing OS or feed enriched data into BI platforms like Tableau or Power BI
- Enterprise scalability proven by agencies and brands managing thousands of client dashboards at once
Matching Your Needs to the Right Platform
Before deciding, map your requirements: How many accounts or clients do you manage? What is the technical complexity of your reporting? Do you need multi-location, multi-channel, or white-label capabilities? The right solution should not only automate routine tasks but also empower your team to deliver insights at scale, adapt quickly, and make data-driven decisions with confidence.
For a deep dive into how TapClicks can unify, automate, and elevate your marketing reporting, visit TapClicks and explore the possibilities for your organization.
Wrapping Up: Why Automated KPI Dashboards Are a Game Changer
Automated KPI reporting dashboards have shifted from being a “nice-to-have” to an absolute must for modern marketing teams. Here’s why:
- Centralized, real-time data: Instantly track performance across every channel, eliminating silos and manual data wrangling.
- Faster, smarter insights: Get to the “why” behind your numbers with AI-driven recommendations and predictive analytics.
- Reduced manual workload: Free up your team from repetitive spreadsheet tasks—focus on strategy, not data entry.
- Customizable, branded reporting: Present insights your way, whether for clients, executives, or internal teams.
TapClicks: Your Partner for Scalable, Insight-Driven Reporting
With TapClicks, agencies, brands, and enterprise teams can:
- Move reporting beyond static spreadsheets
- Unify campaign data and performance analytics in one platform
- Leverage AI-powered insights that actually drive results
- Build stronger client relationships with transparent, real-time reporting
Ready to See the Impact?
Discover how TapClicks can transform your reporting and unlock efficiency at scale:
- Request a demo or start your free trial
- See how automated, data-driven decision making accelerates marketing success
Want to Learn More?
- Dive deeper into the power of real-time dashboards and AI analytics with our [related guides].
- Explore best practices to automate your KPIs and elevate your marketing strategy.
The future of marketing operations is here: Automate your reporting, elevate your insights, and unleash the potential of your data with TapClicks.
Start Automating Your Marketing Data Today!
No Credit Card Required.

