

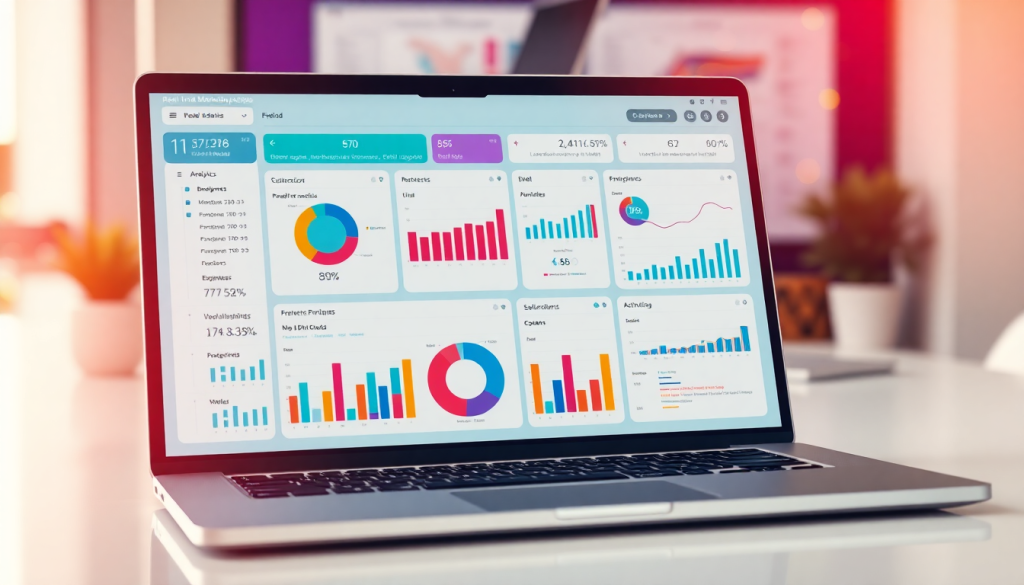
Automated KPI Reporting Dashboard: Real-Time Marketing Insights
Data-driven marketing success depends on more than just collecting numbers—it’s about capturing the right metrics, understanding performance at a glance, and responding quickly to what your campaigns are telling you. An automated KPI reporting dashboard transforms the way marketers track, analyze, and act on their data. Leveraging marketing KPI automation, real-time performance dashboards, and AI analytics reporting, platforms like TapClicks make it possible to automate complex workflows, visualize ROI, and gain actionable insights across every client and channel. This guide will break down how an automated marketing dashboard works, the business impact of reporting automation, and how to choose and implement the right solution for your needs.
What is an Automated KPI Reporting Dashboard?
An automated KPI reporting dashboard is a digital platform that streamlines the collection, analysis, and visualization of your most important marketing metrics—Key Performance Indicators (KPIs)—in real time. Instead of manually piecing together data from spreadsheets, disparate ad platforms, and analytics tools, marketers get a single, always-up-to-date view of campaign performance across every channel and client.
The significance of this automation in digital marketing cannot be overstated. Manual reporting is slow, error-prone, and resource-intensive—often consuming dozens of hours each month just to assemble basic reports. By contrast, marketing KPI automation not only eliminates these bottlenecks but also empowers teams to focus on strategy, optimization, and client communication. Automated dashboards update continuously, surface trends as they happen, and make it easy to visualize the ROI of every campaign.
Platforms like TapClicks are at the forefront of this shift, offering a unified marketing operations solution that integrates data from over 10,000 sources, automates report generation, and enriches dashboards with AI-driven insights. With TapClicks, marketers can deploy branded dashboards at scale, automate scheduled reporting, and ensure that decision-makers always have access to the latest performance data.
To dive deeper into how an automated KPI dashboard can help you visualize metrics and ROI faster, check out this guide on digital marketing KPI dashboard benefits.
What Sets a KPI Automation Platform Apart for Marketers
Marketing teams today juggle dozens of channels, tight deadlines, and ever-changing targets. Static spreadsheets just can’t keep up. Modern KPI automation platforms, like TapClicks, are built to power smarter, faster decisions for agencies, media companies, and brands. Here’s how they do it:
See Your Campaigns in Real Time
- Live Dashboards: Instantly visualize campaign performance as it happens—no more waiting for manual updates.
- Proactive Monitoring: Spot anomalies, trends, and opportunities early, and act before issues escalate.
Automate Metrics and Reporting—at Scale
- Scheduled, Branded Reports: Set it and forget it—reports are automatically generated and delivered to stakeholders.
- Consistent Output: Ensure every client or team receives up-to-date, uniform analytics, even across hundreds of dashboards.
Tap Into AI for Insights, Not Just Numbers
- AI Analytics Reporting: Let AI agents scan your data for hidden trends, optimization opportunities, and surface recommendations.
- Actionable Insights: Move beyond metrics—get context-rich suggestions to drive your next steps.
Unify Your Cross-Channel Data
- Omnichannel Visibility: Aggregate data from search, social, display, email, and more.
- Side-by-Side Comparisons: Identify top-performing channels and optimize budget allocation across your marketing mix.
Visualize Your ROI Instantly
| Feature | What It Delivers |
|---|---|
| ROI Visualization | Clear, intuitive graphical analysis |
| Budget Attribution | See where every dollar is working hardest |
| Value Mapping | Pinpoint campaigns driving true business impact |
Connect and Automate Your Entire Marketing Stack
- 10,000+ Data Connectors: Seamlessly pull data from virtually any platform.
- Automated ETL/ELT Pipelines: Clean, normalize, and enrich data on autopilot.
- Reliable Single Source of Truth: Eliminate data silos and manual wrangling for good.
Ready to See It in Action?
Dive deeper into marketing dashboard automation and AI tools to see how automation transforms marketing operations.
Bottom line:
These aren’t just “nice to have” features—they’re the foundation for scaling, competing, and winning in data-driven marketing. With the right platform, your team can focus on what matters: strategic insights and real results.
How Real-Time Performance Dashboards Drive Better Decisions
In today’s fast-paced marketing landscape, the ability to access and act on up-to-the-minute data is a true competitive advantage. Real-time KPI dashboards empower marketers, agencies, and brands to move beyond static, backward-looking reports and into a world where campaign optimization and budget allocation happen as events unfold—not days or weeks later.
Instant Data, Immediate Action
A real-time performance dashboard aggregates campaign metrics from every source—search, social, display, email, and more—into a single, continuously updated view. This instant access enables marketers to spot trends, anomalies, or underperforming channels as soon as they emerge. For example, if a paid search campaign’s cost-per-acquisition suddenly spikes, a real-time dashboard surfaces that insight immediately, prompting rapid optimization to avoid wasted budget.
Empowering Agencies and Multi-Client Teams
For agencies managing dozens or hundreds of clients, manual data pulls and spreadsheet updates can eat up hours every week. Automated dashboards eliminate this burden, providing account managers and analysts with a live window into campaign performance across all clients. This means faster turnaround on client questions, more proactive strategy adjustments, and the ability to deliver greater value—without increasing team workload.
Driving Better Outcomes for Clients and Stakeholders
With real-time data at their fingertips, marketing teams can shift resources to the channels and tactics delivering the best results, while quickly addressing issues before they escalate. For instance, a national brand running a multi-location campaign can instantly compare performance by region, double down on what’s working, and share transparent, up-to-date results with local managers and executives.
Ultimately, real-time performance dashboards transform reporting from a static chore into a dynamic decision engine. By enabling continuous monitoring and agile response, these dashboards help marketers maximize ROI, deliver superior client experiences, and stay ahead of the competition. To learn more about the latest advances in dashboard automation and AI-powered analytics, explore TapClicks' marketing dashboard automation and AI tools or visit the TapClicks website for a deeper look at unified marketing analytics in action.
AI Analytics Reporting: Turning Data Into Actionable Insights
In today’s fast-paced marketing landscape, accessing data is just the beginning—the real value lies in what you do with it. This is where AI analytics reporting becomes a game-changer for automated marketing dashboards. At its core, AI analytics reporting leverages machine learning and intelligent algorithms to analyze vast datasets, uncover hidden patterns, and deliver actionable insights that drive smarter marketing decisions.
Unlike traditional dashboards that simply present numbers, AI-powered solutions scan your marketing KPIs in real time, identifying trends, anomalies, and performance drivers that might otherwise go unnoticed. For example, an automated dashboard equipped with AI can instantly flag underperforming channels, recommend budget reallocations, or predict where future ROI will come from—empowering marketers to optimize campaigns on the fly.
TapClicks takes AI analytics reporting to the next level with its proprietary AI Agents and SmartPilot technology. These advanced features do more than just monitor data; they actively interpret it, surfacing key insights and providing optimization recommendations tailored to your campaigns. Imagine receiving a SmartEmail: a concise, AI-curated summary of your most important campaign metrics and performance insights, delivered straight to your inbox or your client’s—no manual analysis required. This accelerates decision-making, reduces time spent on manual reporting, and ensures that both teams and clients are always working from the latest, most relevant insights.
By bridging the gap between data and action, AI analytics reporting transforms your dashboard from a passive reporting tool into a proactive, strategic asset. To explore how TapClicks’ AI-driven solutions can help you unlock deeper insights and drive better marketing outcomes, visit TapClicks.
Cross-Channel Performance Analytics and ROI Visualization
Modern marketing is a multi-channel game. Audiences aren’t just on one platform—they’re bouncing between paid search, social, display, email, and even offline touchpoints. To truly understand performance and maximize ROI, marketers need more than siloed reports and endless spreadsheets. They need a unified, cross-channel view.
Why Unified Analytics Matter
Here’s what unified analytics unlock:
- No more data silos: See how each touchpoint contributes to the customer journey.
- Apples-to-apples comparisons: Normalize metrics (impressions, clicks, conversions, spend, ROAS) across ALL channels.
- One dashboard, endless insights: TapClicks blends data from 10,000+ sources, so you can analyze Google Ads, Facebook, programmatic, email, and offline campaigns—side by side.
- Ditch the manual work: Say goodbye to spreadsheet wrangling and platform toggling.
Bringing ROI to Life with Visualization
TapClicks doesn’t just collect your data—it makes it actionable, fast:
- Custom, drag-and-drop dashboards: Build views that spotlight what matters—whether that’s channel ROI, campaign pacing, or budget trends.
- Flexible filtering & segmentation: Analyze results by region, team, brand, or client.
- Automated, branded reports: Schedule delivery to stakeholders so everyone’s in the loop, in real time.
| What You Can Visualize | How It Helps You Decide |
|---|---|
| Channel-level ROI | Invest in what’s truly working |
| Campaign pacing | Stay on track with budget and timelines |
| Regional performance | Double down on high-performing markets |
| Multi-client results | Deliver custom insights at scale |
Reporting at Scale: Multi-Channel, Multi-Location, Multi-Client
With TapClicks, complex organizations get reporting that fits their needs:
- Agencies:
- Manage thousands of dashboards for hundreds of clients
- Automate reporting by client, channel, or campaign
- Brands & Enterprises:
- Drill down by market, region, or store
- Maintain a consolidated, top-level view for leadership
Unified cross-channel analytics and ROI visualization aren’t just nice-to-haves—they’re mission critical for marketers who want clear answers and confident next steps.
Ready to see which channels deliver, where to optimize spend, and how your campaigns add up to real business impact?
Learn more about TapClicks’ unified analytics and reporting capabilities here.
Setting Up Automated Analytics Workflows
Implementing an automated KPI reporting dashboard doesn’t have to be daunting—especially with platforms like TapClicks that streamline the process from end to end. A successful setup begins by identifying your most critical marketing KPIs and the data sources that feed them. Next, you’ll want to leverage robust data connectors—like the 10,000+ integrations available with TapClicks—to automatically pull in performance data from channels such as Google Ads, Facebook, LinkedIn, and beyond.
Once your data sources are connected, TapClicks’ automated ETL/ELT pipeline takes center stage. This engine extracts, transforms, and loads your marketing data, normalizing metrics across platforms and campaigns to create a unified analytics foundation. The result: you eliminate manual exports, reduce spreadsheet headaches, and ensure consistency in every report.
Workflow automation is key to minimizing repetitive tasks. TapClicks enables you to automate the scheduling, generation, and distribution of client-ready reports, freeing up marketing teams to focus on strategy and optimization. Built-in tools like TapOrders and TapWorkflow allow you to centralize campaign requests, approvals, and fulfillment processes—ensuring every stakeholder stays in the loop without endless email threads.
Finally, AI-driven features like TapInsights and SmartEmail automate the delivery of actionable campaign insights straight to your inbox or your client’s. This means you and your clients are always up-to-date on what matters most, without ever having to chase down the latest numbers.
For a deeper dive into workflow automation and campaign insights, check out this guide to automating campaign insights with TapClicks. By following these steps and embracing automation, you’ll not only save time but also unlock faster, more informed decision-making—giving your agency or brand a powerful competitive edge.
Choosing the Right Client KPI Reporting Tool
Selecting the right KPI reporting dashboard is crucial for agencies, brands, and enterprise marketing teams seeking to maximize efficiency and deliver exceptional value to clients. With a crowded landscape of marketing analytics platforms, it’s important to focus on a few foundational criteria to guide your decision:
1. Scalability for Growth
Your reporting solution should seamlessly scale as your business and client roster grows. Ask: Can the platform handle hundreds or thousands of dashboards, reports, and users without performance bottlenecks? Platforms like TapClicks are engineered for high-volume operations, making them a strong fit for agencies with multi-client or multi-location needs.
2. Customization and Branding
Client expectations for personalized, branded experiences are higher than ever. Evaluate whether dashboards and reports can be fully customized to reflect your clients’ brand identities, unique KPIs, and preferred visualization styles. Automated report scheduling and white-labeling are essential features for agencies aiming to deliver professional, client-centric reporting at scale.
3. Robust Integrations
Data is siloed across countless ad platforms, CRMs, analytics tools, and more. Consider solutions that offer broad, flexible integrations—TapClicks leads with 10,000+ marketing, advertising, and business data connectors, while many competitors may only support a limited set of platforms or require manual data wrangling.
4. User Experience & Automation
Ease of use is critical: intuitive dashboard builders, drag-and-drop interfaces, and automated workflows will save your team hours every month. Look for platforms with advanced automation—such as scheduled report delivery, AI-powered insights, and workflow management—that reduce manual tasks and minimize the risk of error.
5. AI-Powered Insights
Modern reporting platforms should do more than display data—they should help you interpret it. AI-powered features, like TapClicks’ SmartEmail and SmartPilot, proactively surface optimization opportunities and campaign recommendations, accelerating your team’s ability to act on insights.
Comparing TapClicks to Other Options
While solutions like Funnel.io, Adverity, and Supermetrics focus on data aggregation and pipeline management, they often lack the comprehensive workflow, client management, and AI analytics capabilities that TapClicks delivers. Lightweight tools such as Agency Analytics and NinjaCat may be suitable for smaller agencies but can struggle with enterprise-scale needs. TapClicks stands out for its blend of unified data integration, advanced automation, and multi-client scalability.
Key Questions to Ask Vendors
- How many data connectors are supported, and how flexible are custom integrations?
- Can dashboards be fully customized and white-labeled for each client?
- What AI-driven features are available for insights and campaign recommendations?
- How does the platform handle large-scale, multi-client reporting?
- What support and onboarding resources are provided to ensure a smooth implementation?
Taking a strategic approach to vendor evaluation ensures your KPI reporting tool will not only meet your current needs but set your agency or brand up for long-term success. For a deeper dive into automating campaign insights and platform comparisons, see this guide on performance marketing reporting automation.
The ROI of Data-Driven Marketing Dashboards
Investing in an automated KPI reporting dashboard is more than a technological upgrade—it’s a strategic move that pays measurable dividends across your marketing operations. The return on investment (ROI) becomes clear when you consider the dramatic time savings, improved data accuracy, and enhanced client relationships that automation delivers.
Time and Resource Savings: One of the most immediate benefits of reporting automation is the significant reduction in manual data collection and spreadsheet wrangling. Platforms like TapClicks routinely save marketing analysts 50+ hours per month by automating routine data pulls, report generation, and dashboard updates. This reclaimed time can be redirected toward campaign strategy, creative optimizations, and higher-value client interactions.
Accuracy and Transparency: Automated dashboards virtually eliminate the risk of human error inherent in manual reporting. With seamless data integration and real-time syncing across all channels, marketers can trust that every metric and KPI reflects the latest, most accurate information. This transparency not only supports internal decision-making but also builds trust with clients, who gain 24/7 access to up-to-date performance metrics through branded, customizable dashboards.
Client Satisfaction and Retention: Automation empowers agencies and marketing teams to deliver faster, more insightful reporting, complete with AI-driven recommendations and clear ROI visualizations. Clients receive timely, relevant insights—whether via interactive dashboards or automated SmartEmail summaries—strengthening your reputation as a proactive, results-driven partner. The result: improved client satisfaction, increased retention, and more opportunities for upselling or growing accounts.
Ultimately, a data-driven marketing dashboard is more than a reporting tool—it’s an engine for operational efficiency and business growth. If you’re ready to unlock these benefits for your team or clients, explore how TapClicks’ reporting automation can transform your marketing analytics workflow.
Start Automating Your Marketing Data Today!
No Credit Card Required.

