

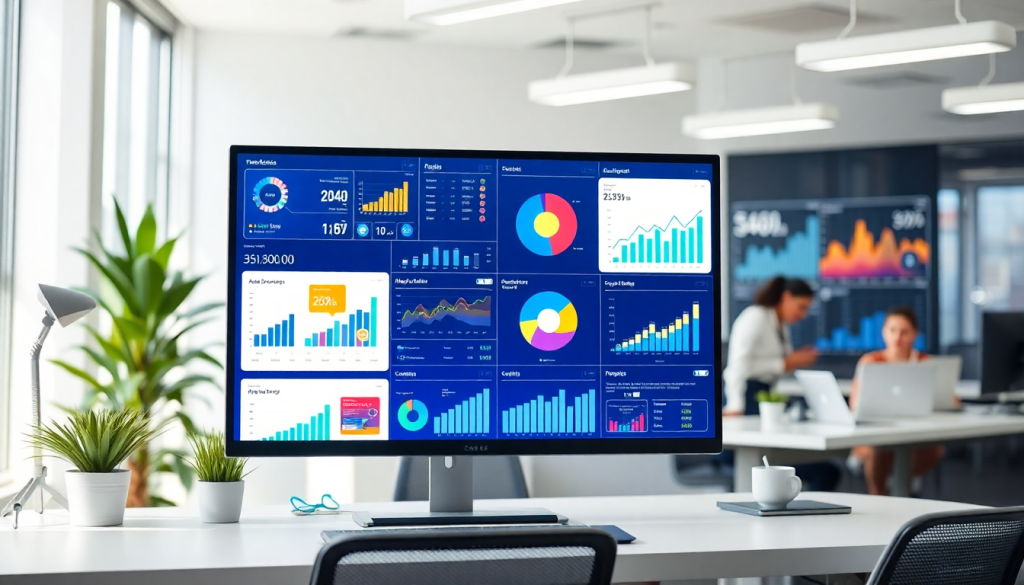
Automated KPI Reporting Dashboard: Real-Time Marketing Insights
Marketing teams face a constant challenge: how to track key performance indicators (KPIs) across multiple channels, clients, and campaigns—without drowning in manual data wrangling. An automated KPI reporting dashboard transforms this process, delivering real-time insights, streamlined analytics, and AI-powered recommendations. With tools like TapClicks, you can unify data sources, automate reporting workflows, and surface actionable marketing intelligence for better decision-making and client value. Here’s a clear, comprehensive guide to building, using, and optimizing an automated KPI reporting dashboard for your marketing operations.
The Value of an Automated KPI Reporting Dashboard
In today’s fast-paced marketing landscape, automation isn’t just a luxury—it’s a necessity for effective KPI tracking at scale. As marketing teams juggle dozens of channels, campaigns, and clients, the old way of manually collecting, cleaning, and compiling data quickly becomes unsustainable. Manual reporting is time-consuming, error-prone, and often leads to outdated insights by the time reports reach decision-makers. When every minute counts, even small inefficiencies compound into lost opportunities and frustrated teams.
Automated KPI reporting dashboards directly address these challenges. By centralizing all your marketing data into a single, real-time view, automation eliminates repetitive manual tasks and the risk of human error. Analysts can reclaim hours previously spent wrangling spreadsheets and instead focus on interpreting trends and optimizing campaigns. This efficiency can translate to 50+ hours saved per analyst each month, a game-changer for agencies and enterprise marketing departments alike.
Beyond time savings, automation brings consistency and accuracy. Real-time dashboards ensure that everyone—executives, campaign managers, and clients—works from the same up-to-date data. This transparency fosters trust and accelerates decision-making. As outlined in this post on digital marketing KPI dashboards, automated dashboards also unlock deeper insights by enabling quick comparisons across channels, surfacing anomalies, and generating AI-powered recommendations without manual intervention.
Ultimately, an automated KPI reporting dashboard isn’t just about efficiency; it’s about empowering teams to act on timely, reliable insights, driving better marketing outcomes and stronger client relationships. For those looking to stay ahead in a data-driven world, automation is the foundation for success.
What Makes a Real-Time Performance Dashboard Truly Powerful?
A great automated KPI dashboard isn’t just for show—it’s the engine room for smarter, faster marketing decisions. Here’s what to look for as you evaluate your options:
Data Integration: The Heartbeat of Your Dashboard
- Connect Everything: Opt for solutions with thousands of native connectors. Platforms like TapClicks can unify data from:
- Search (Google Ads, Bing, etc.)
- Social (Meta, LinkedIn, TikTok)
- Display & Programmatic
- Email Marketing
- Offline Channels (call tracking, in-store, etc.)
- No More Manual Exports: Centralized data means your numbers are always up to date—no spreadsheets required.
Always-On, Up-to-the-Minute Insights
- Live Data Feeds: Your dashboard should refresh in real time, not just daily or weekly.
- Instant Trend Detection: Spot anomalies, spikes, or dips as soon as they happen—so you can act, not just react.
Make It Yours: Custom Widgets and Layouts
- Drag-and-Drop Simplicity: Build dashboards with widgets that fit your KPIs.
- Tailored Views: Filter and customize by:
- Client
- Campaign
- Channel
- Highlight What Matters: Whether it’s ROAS, CPA, or impression share, put your most important numbers front and center.
See the Full Picture: Cross-Channel Analytics
- Unified Reporting: Blend and normalize data from every platform.
- Holistic Attribution: Benchmark and compare performance side by side.
- Smarter Budgeting: Optimize spend across channels with a single source of truth.
Let AI Do the Heavy Lifting
- Automated Insights: Tap into AI to surface trends, opportunities, and risks—before you have to hunt for them.
- Predictive Analytics: Use machine learning to forecast results and get optimization recommendations.
- Auto-Generated Summaries: Features like TapClicks’ SmartEmail deliver digestible insights to your inbox.
Automate, Don’t Agonize: Marketing Metrics & Reporting
- Scheduled, Branded Reports: Automate delivery to clients or stakeholders.
- Zero Manual Work: Save hours each week and reduce human error.
- Always Accurate: Ensure every recipient gets the latest, most reliable data.
| Feature | Why It Matters | Example (TapClicks) |
|---|---|---|
| Data Integration | Unified source of truth | 10,000+ native connectors |
| Real-Time Updates | Immediate insights, faster decisions | Live dashboard refresh |
| Custom Widgets & Layouts | Personalization for your KPIs | Drag-and-drop dashboard builder |
| Cross-Channel Analytics | True performance benchmarking | Multi-channel normalization & blended views |
| AI & Predictive Insights | Actionable recommendations | SmartPilot, SmartEmail, automated summaries |
| Automated Reporting | More time for strategy, less grunt work | Scheduled, branded, client-ready reports |
Want to see how these features drive real ROI? Explore this guide.
When all these elements come together, your dashboard isn’t just a report—it’s your marketing command center, ready to empower smarter, faster, and more confident decisions.
How TapClicks Powers Marketing KPI Automation
For marketing teams seeking a robust, unified approach to automated analytics, TapClicks stands out as a comprehensive solution. It’s much more than a reporting tool; TapClicks is a full-fledged marketing operations platform designed to automate the entire analytics workflow—from data integration to AI-driven recommendations—at scale.
Seamless Connection to 10,000+ Marketing Data Sources
One of TapClicks’ core strengths is its unrivaled connectivity. Through its TapData and Smart Connectors, TapClicks can automatically ingest data from over 10,000 marketing, advertising, and business sources. Whether you’re tracking Google Ads, Facebook campaigns, programmatic platforms, or niche data feeds, TapClicks centralizes it all—eliminating the need for manual exports or custom integrations.
Branded Reporting and Smart Visualization
No more spending hours building client presentations or internal dashboards. TapClicks offers a drag-and-drop reporting studio, enabling marketers and agencies to design fully branded dashboards that update in real time. Automated scheduling and delivery mean your stakeholders always receive the latest insights without lifting a finger. You can dive deeper into how TapClicks automates reporting workflows in this article on marketing dashboard automation.
AI Insights and Automated Recommendations
Going beyond static dashboards, TapClicks leverages AI and machine learning to surface actionable insights. Built-in AI Agents analyze campaign data, flag anomalies, and provide optimization recommendations—enabling marketers to proactively address performance issues and capitalize on opportunities. The SmartEmail feature even delivers automated, AI-curated summaries and insights directly to your team or clients’ inboxes.
Workflow Automation for Marketing Operations
TapClicks isn’t just about data and visuals; it streamlines end-to-end marketing operations. Its workflow modules allow you to manage campaign orders, assign tasks, and collaborate across roles—all within the same platform. Automated processes ensure that campaign launches, optimizations, and reporting happen smoothly and on time, drastically reducing manual effort and human error.
For organizations managing hundreds (or thousands) of campaigns, clients, or locations, the power of TapClicks lies in its scale, intelligence, and operational efficiency. To learn more about how TapClicks can automate your KPI reporting and analytics workflows, visit TapClicks’ official site or explore their latest innovations in reporting automation.
Building a Data-Driven Marketing Dashboard That Actually Moves the Needle
Designing an automated KPI dashboard isn’t just about connecting your data—it’s about surfacing insights that drive smarter, faster marketing decisions. Here’s a practical, step-by-step playbook for building dashboards that deliver true business value.
Start with Your Goals (and Only the KPIs That Matter)
Before you touch a dashboard widget, get crystal clear on what you’re trying to achieve:
- Are you focused on:
- Lead generation?
- Brand awareness?
- Multi-channel conversions?
- Pick KPIs that map directly to those goals:
- Cost per acquisition (CPA)
- Return on ad spend (ROAS)
- Engagement rates
Tip: Don’t overload your dashboard—prioritize metrics that drive decisions, not just “nice-to-have” stats.
Learn more about KPI selection in our analytics guide.
Bring All Your Data Together—And Make It Make Sense
A dashboard is only as strong as its data foundation. Here’s what to do:
-
Connect every channel:
Use TapClicks’ 10,000+ integrations to pull in data from Google Ads, Facebook, programmatic, CRM, and more. -
Normalize and enrich:
- Ensure definitions match across channels (e.g., a “lead” means the same thing everywhere).
- Blend datasets for a holistic, apples-to-apples view.
-
Validate for consistency:
- Double-check that metrics align before reporting.
Make It Clear, Make It Actionable
A cluttered dashboard hides insights. Design yours to highlight what matters:
- Organize KPIs: By channel, funnel stage, or region.
- Use smart visuals:
- Custom widgets
- Trend lines
- Color coding for outliers and shifts
- Every chart answers a question:
If it doesn’t, cut it!
Automate the Boring Stuff and Let AI Do the Heavy Lifting
Manual updates and reporting are time sinks. Save hours every week by:
- Automating data refreshes so your team always sees the latest performance.
- Scheduling report delivery directly to stakeholders.
- Activating AI insights:
- TapClicks’ SmartPilot spots anomalies and recommends optimizations.
- SmartEmail delivers AI-generated summaries right to your inbox.
Iterate, Improve, Repeat
Dashboards aren’t “set it and forget it.” Keep them sharp by:
- Gathering team/client feedback:
What’s useful? What’s missing? - Updating KPIs and layouts:
Add, remove, or adjust widgets based on evolving strategy. - Refining visuals:
Make sure the story is always clear.
Success Checklist
- KPIs are tightly aligned with business goals
- All data is normalized and consistent
- Visuals highlight trends and outliers
- Reports and insights are automated
- Dashboard evolves with feedback
Unlock even more practical tips and see dashboard automation in action:
Explore our latest guide on real-time analytics and AI-powered dashboards.
Cross-Channel Performance Analytics: Bringing Your Data Together
Modern marketing happens everywhere—across search, social, display, programmatic, video, and beyond. But with so many platforms, getting a complete view of performance can feel impossible. That’s why cross-channel performance analytics isn’t just helpful; it’s essential for optimizing spend, proving ROI, and making confident decisions.
The Multi-Channel Maze: Common Challenges
Here’s what most marketers face:
- Fragmented data: Metrics are stuck in separate ad platforms, CRMs, or email tools.
- Manual reporting: Analysts spend hours wrangling spreadsheets, risking errors and duplication.
- Siloed insights: Teams miss out on seeing the full picture or identifying cross-channel trends.
How TapClicks Breaks Down Silos
TapClicks solves these headaches with a unified, all-in-one marketing operations platform. Here’s how it works:
1. Massive Data Connectivity
- 10,000+ connectors for marketing, advertising, and business data sources
- Pulls in data from Google Ads, Facebook, programmatic DSPs, email platforms, and more
2. Automated Data Processing
- Automated ETL/ELT pipelines extract, transform, and load data
- Standardizes and structures data—no matter the original format or source
3. Powerful Data Blending & Normalization
- Blend campaign data across digital and traditional channels
- Normalize metrics for apples-to-apples comparison (e.g., impressions, conversions, spend)
- Roll up performance by:
- Location
- Region
- Client
- Campaign type
4. Multi-Tenant Architecture for Agencies
- Manage multiple clients’ data securely in one environment
- Cross-client reporting is both scalable and secure
What Does This Mean For You?
With TapClicks, you get:
| Pain Point | With TapClicks |
|---|---|
| Data silos | Unified dashboard with all channel data in one place |
| Manual wrangling | Automated, real-time analytics and reporting |
| Incomplete insights | Holistic, cross-channel performance visibility |
Real-World Results
- Instantly compare performance across brands, locations, or campaign types
- Identify trends and allocate budget where it matters most
- Deliver high-value, scalable reporting to every client or stakeholder
Bottom line:
With TapClicks, you move from piecemeal reporting to a single source of truth—making it easy to see what’s working, spot opportunities, and optimize campaigns at scale. No more spreadsheet chaos. Just actionable cross-channel insights, right when you need them.
Client KPI Reporting Tools and Automated Workflows
For agencies and media companies managing dozens—or even hundreds—of client accounts, efficient, transparent KPI reporting is mission-critical. Automated KPI reporting dashboards are more than just data visualizations; they are end-to-end client communication and workflow solutions that modernize how agencies deliver value and build trust.
Dashboards for Seamless Client Reporting
A robust reporting platform like TapClicks enables agencies to centralize all client campaign data, from paid media and SEO to social and OTT. With customizable dashboards, each client or brand location can access a personalized view of their KPIs, ensuring that performance updates are always relevant and on-brand. Branded dashboards and reports not only elevate professionalism, but also reinforce agency expertise by making complex analytics accessible and actionable for clients.
Workflow Features That Power Productivity
Automated workflows are key to scaling client reporting without sacrificing quality or timeliness. TapClicks offers role-based access, allowing different stakeholders—clients, account managers, analysts—to see only the data and dashboards relevant to them. This ensures confidentiality, simplifies navigation, and streamlines collaboration between internal teams and clients.
Scheduling and automated delivery features take the manual labor out of reporting. Agencies can pre-set recurring report runs—weekly, monthly, or customized intervals—so clients receive the latest insights right in their inbox, without any analyst intervention. This not only saves hours of repetitive work but also guarantees that stakeholders always have up-to-date performance intelligence at their fingertips.
Enhancing Transparency and Collaboration
Automated reporting dashboards pave the way for greater transparency. Clients can drill into metrics themselves, review campaign goals, and flag questions directly within the dashboard environment. The result is a more collaborative relationship: instead of waiting for static PDF reports or one-off email updates, clients engage with real-time data and can work with their agency partners to adjust strategies on the fly.
By automating reporting workflows with a platform like TapClicks, agencies and media companies dramatically reduce reporting overhead, improve client satisfaction, and create the operational flexibility needed to scale. Automated KPI dashboards aren’t just a tool—they’re the foundation of a modern, client-centric marketing operation.
Visualizing ROI and Performance: Turning Raw Data Into Action
Gone are the days of wrestling with static spreadsheets. Today’s marketing teams are leveraging automated KPI dashboards to gain a real-time, interactive view of campaign performance. With TapClicks, you can move beyond data silos and see the full marketing funnel—from first engagement to final ROI—all in one place.
Why Visual Dashboards Beat Static Reports
- Instant Insights: No more waiting for end-of-month summaries. TapClicks dashboards update as soon as new data arrives.
- All-in-One View: Overlay paid search ROI, organic social engagement, and even local store traffic—no more toggling between platforms or files.
- Collaboration Built In: Annotate trends, share findings, and collaborate in real time right within the dashboard.
Making Metrics Meaningful—How TapClicks Helps
With TapClicks, complex metrics become easy to understand:
| Metric | What You See in TapClicks | Why It Matters |
|---|---|---|
| Cost Per Acquisition | Color-coded trend lines & goal tracking | Spot overspending instantly |
| Conversion Rates | Customizable widgets & heatmaps | See which campaigns convert best |
| Multi-Channel Attribution | Side-by-side channel comparisons | Optimize your channel mix |
These visuals mean you can:
- Spot trends and anomalies at a glance
- Drill down into specifics with just a click
- Empower every stakeholder (even non-analysts!) to understand the story behind the numbers
AI-Driven Insights: Your Built-In Analyst
TapClicks is more than just a pretty dashboard. Its AI-powered analytics take things to the next level:
- SmartPilot & SmartEmail: Get proactive alerts about budget pacing, underperforming campaigns, or sudden spikes in spend.
- Automated Benchmarking: Instantly see how your KPIs stack up against historical data or industry benchmarks.
- Optimization Suggestions: Receive data-backed recommendations for tweaking campaigns on the fly.
From Reporting to Real-Time Action
Here’s how TapClicks transforms reporting into a strategic advantage:
- Connect all your marketing channels in minutes (10,000+ integrations available).
- Visualize key KPIs with drag-and-drop dashboards customized for your team.
- Receive AI-powered recommendations—no data science degree required.
- Collaborate, annotate, and share insights across teams and clients instantly.
Ready to see your marketing data in action?
Discover how TapClicks makes reporting and optimization effortless at TapClicks.
How to Find an Automated Analytics Platform That Fits Your Team
The right analytics solution can make or break your marketing operation—especially when you’re managing campaigns at scale. Let’s break down what actually matters during your search, and how TapClicks compares to other platforms.
What Should You Look For?
Ask these questions as you explore analytics platforms:
- Can it scale with your agency or brand?
- Will it handle hundreds (or thousands) of dashboards, reports, and users without slowdown?
- How deep is its data integration?
- Does it offer native connectors for all your marketing, ad, and business platforms?
- Are “custom connectors” actually robust, or are you limited to a handful of sources?
- Does it automate the heavy lifting?
- Look for features like automated ETL (extract, transform, load), recurring reporting, and scheduled delivery.
- Does it support workflow collaboration—role-based access, approvals, and client communication?
- Are the AI features more than just buzzwords?
- Does the platform surface actionable insights, performance scores, and predictive recommendations?
- Can you customize everything?
- From dashboard branding to widget design—does the platform bend to your needs, or force you to adapt?
- Is data export flexible (e.g., to BI tools like Tableau, Power BI, etc.)?
How TapClicks Measures Up
| Criteria | TapClicks | Funnel.io/Supermetrics | Agency Analytics/NinjaCat | Datorama (Salesforce) |
|---|---|---|---|---|
| Scale | Built for thousands of dashboards | Limited | SMB focus | Enterprise, but complex |
| Data Integration | 10,000+ native connectors | Pipes only, fewer native | Fewer connectors | Many, but setup-intensive |
| Automation & Workflow | Full MOP: ETL, reporting, collaboration | Basic automation | Basic scheduling | Complex, requires setup |
| AI & Insights | Predictive, recommendations, scoring | None/minimal | Minimal AI | Strong, but steeper curve |
| Customization | Highly flexible, BI export | Limited | Limited branding | Flexible, but complex |
| Onboarding | Fast, intuitive | Fast | Fast | Slower, steeper learning |
Take the Platform for a Test Drive
Before you commit:
- Connect your own real data. How fast can you get dashboards live?
- Build a report. Does it automate delivery and insights, or are you still doing manual work?
- Test AI recommendations. Are they genuinely helpful, or just surface-level?
- Check user roles and workflow. Can your team collaborate—sales, ops, fulfillment—inside the platform?
- Assess support and training. Is the vendor there to help you succeed?
Why It Matters
The right automated analytics platform will:
- Replace reporting bottlenecks with real-time insights
- Unify marketing data across every source and channel
- Empower your team to act on AI-driven recommendations, not just data dumps
With TapClicks, you get a true “marketing OS” designed for scale, speed, and actionable intelligence—turning analytics from a chore into your competitive advantage.
Start Automating Your Marketing Data Today!
No Credit Card Required.

