

Automated KPI Reporting Dashboard: Real-Time Marketing Insights
Marketing teams are under constant pressure to prove ROI, optimize campaigns, and deliver actionable insights—fast. An automated KPI reporting dashboard brings together complex data, AI-driven analytics, and real-time performance tracking into a single, easy-to-use platform. With TapClicks, marketing KPI automation isn’t just about saving time; it’s about empowering your team to make smarter decisions, visualize success, and scale client reporting seamlessly. This guide explores how automated dashboards can transform the way you track, analyze, and communicate marketing results.
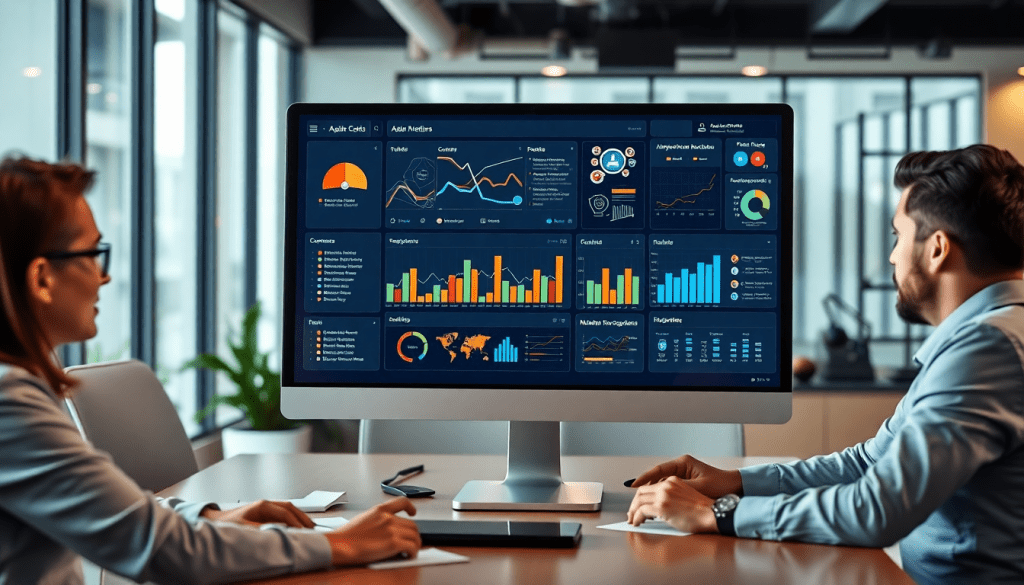
What is an Automated KPI Reporting Dashboard?
An automated KPI reporting dashboard is a dynamic, digital workspace where key marketing performance indicators (KPIs) are continuously tracked, analyzed, and visualized—without the need for manual data collection or spreadsheet wrangling. At its core, automation means that the system connects directly to your marketing data sources (such as ad platforms, CRM systems, and analytics tools), pulls in fresh data in real time or on a set schedule, and updates all your metrics, charts, and insights automatically.
The real-time capability of an automated dashboard is crucial in today’s fast-paced marketing environment. Marketers no longer have to wait for end-of-month reports or scramble to compile numbers from multiple channels. Instead, they get an up-to-the-minute view of campaign performance, budget pacing, and ROI—enabling agile decision-making and rapid course correction.
The primary purpose of an automated KPI dashboard is to centralize, calculate, and visualize all your critical marketing metrics in one place, with minimal manual effort. This allows teams to focus less on data preparation and more on strategy, optimization, and storytelling. Whether you’re managing a single brand or hundreds of clients, automation ensures that your reporting is accurate, consistent, and always ready when stakeholders need it.
TapClicks is recognized as a leader in this space, setting the standard for scalable, AI-powered KPI automation. With robust data integration, real-time analytics, and intuitive visualization tools, TapClicks empowers marketers to move beyond static reporting and embrace continuous insight delivery. For a deeper dive into what sets automated dashboards apart, explore "Automated KPI Reporting Dashboard: TapClicks AI Platform", which outlines how TapClicks transforms raw data into actionable intelligence at scale.
Why Automating Your Marketing KPIs Makes a Real Difference
Automating KPI reporting is a game-changer for marketing teams—especially for agencies, brands, and enterprises managing multiple campaigns or clients. Here’s how automation transforms your workflow and results:
Save Time on Every Report
- Eliminate Manual Work: No more copy-pasting data or wrangling spreadsheets.
- Real-Time Data Feeds: Automated dashboards pull data directly from all your marketing platforms.
- Instant Updates: Reports refresh automatically—no need to rebuild each month.
- Proven Results: With TapClicks, marketing teams typically save 50+ hours per analyst per month.
Get Reliable, Error-Free Data—Every Time
- Standardized Metrics: Ensure everyone is working from the same definitions and calculations.
- Consistent Accuracy: Automation reduces human error, outdated numbers, and accidental mistakes.
- One Source of Truth: All stakeholders—internal and external—see the same reliable data.
Easily Scale as You Grow
- Effortless Onboarding: Add new clients or data sources in minutes, not days.
- Centralized Analytics: Manage reporting across brands, regions, or locations from a single platform.
- Handle More, with Less Stress: Automated systems are built for high volume—no matter how many campaigns or dashboards you need.
Delight Clients with Transparency & Access
- Always-On Reporting: Clients can access their KPIs anytime, without waiting for static reports.
- Interactive Dashboards: Visual, drill-down reports engage clients and stakeholders.
- Build Trust: Transparency positions your team as proactive and data-driven.
Make Smarter Decisions, Faster
- Spot Trends Instantly: Real-time visualizations help you act on opportunities or risks as they happen.
- AI-Driven Insights: TapClicks surfaces anomalies, flags what matters, and even recommends optimizations.
- Prove ROI: Confidently show the impact of your marketing efforts, supported by up-to-date data.
Bottom Line:
Automating your KPI reporting isn’t just about efficiency (though you’ll love the time savings). It’s about empowering your team to make better, faster decisions—turning marketing data into a genuine competitive edge for your agency or brand.
What Makes a Real-Time Performance Dashboard Truly Powerful?
Automated KPI reporting is only as good as the dashboard behind it. To deliver value—especially at scale—your dashboard should do much more than display static charts. Here’s what separates a high-performing real-time marketing dashboard from the rest:
🚦 Bring All Your Data Together
Cross-Channel Integration
- Seamlessly connect every marketing data source: search, social, display, CRM, and more
- Eliminate manual imports and data silos
- TapClicks Advantage: 10,000+ pre-built connectors for marketing, advertising, and business platforms
- Effortlessly blend and normalize multi-platform or multi-client data
🔄 Stay Up-to-the-Minute
Real-Time Updates
- Automatic data refresh as new info arrives
- Spot performance shifts and react instantly
- TapClicks Edge: Automated ETL pipelines—no more manual uploads or waiting for batch jobs
- Keep your team and clients always in the know
🎯 Make Dashboards Your Own
Custom Metrics & Visualizations
- Define unique KPIs that matter most to your business
- Combine and calculate metrics across channels
- Tailor visuals to the specific needs of stakeholders
- TapClicks Studio: Drag-and-drop dashboard builder for branded, client-ready reports
🚨 Never Miss a Critical Change
Automated Alerts & Notifications
- Real-time alerts for anomalies, budget pacing, or hitting goals
- Push notifications internally or direct to clients
- TapClicks Solution: Scheduled reports and proactive notifications—so you’re always on top of your campaigns
🤖 Turn Data Into Strategy
AI-Powered Analytics & Insights
- Built-in AI agents analyze dashboards to surface trends and recommendations
- Automated summaries transform raw data into actionable insights
- TapClicks Innovation: SmartPilot and SmartEmail deliver clear, AI-driven insights straight to your (or your client’s) inbox
🚀 Scale Without the Headaches
User-Friendly, Scalable Dashboards
- Intuitive navigation and one-click report generation
- Role-based access so the right people see the right data
- Designed to handle hundreds or thousands of dashboards and users
- TapClicks Purpose: Built for agencies and enterprises managing multi-client, multi-location, and multi-channel reporting
Want to See It in Action?
Curious how all these features combine in a real-world platform?
Explore the “TapClicks AI Platform Guide” for a deep dive, or visit TapClicks to see how TapClicks delivers cross-channel, real-time, and AI-driven analytics at scale.
Give your marketing operations the unified, automated foundation they need to thrive.
How Automated KPI Dashboards Power Data-Driven Marketing Workflows
Automated KPI dashboards do more than simply display numbers—they become the operational nerve center of a modern marketing team. By integrating seamlessly into the marketing operations process, these dashboards connect every stage of the campaign lifecycle, from initial launch and in-flight optimization to post-campaign analysis and reporting.
At the start, an automated dashboard aggregates data from disparate sources—search, social, programmatic, CRM, and more—without the need for manual data pulls or spreadsheet wrangling. This unified data foundation means marketers can instantly visualize performance across every channel and client, removing the data silos that slow down decision-making.
As campaigns run, real-time analytics workflows take over. Automated KPI dashboards like TapClicks continuously ingest new performance data, calculate key metrics, and trigger alerts when results deviate from benchmarks or pacing goals. This enables marketing teams to catch underperforming tactics early, shift budgets, and optimize creative—all without waiting for the next manual report cycle. The entire process is streamlined: time previously spent on gathering and cleaning data is now invested in strategy and action.
Crucially, these dashboards foster a data-driven culture by making insights accessible and actionable. Automated pipelines ensure that every stakeholder—whether on the agency, brand, or executive side—sees the same up-to-date, cross-channel KPIs. Advanced platforms like TapClicks even layer in AI-powered analytics, surfacing optimization recommendations and predictive insights directly within the dashboard. This not only accelerates campaign improvements but also enhances transparency and trust with clients.
By unifying campaign tracking, analytics, and reporting, automated KPI dashboards transform marketing workflows into a continuous cycle of improvement. The result: less time spent on data management, more time driving measurable impact.
TapClicks Reporting Automation: Streamlining Metrics, Insights, and ROI
TapClicks sets itself apart in the crowded landscape of marketing dashboard solutions by combining robust automation with AI-powered intelligence and intuitive design. At the heart of the platform is the drag-and-drop dashboard builder, which allows users to create visually compelling, client-ready reports in minutes—no coding required. Whether you’re an agency juggling hundreds of client accounts or an enterprise marketing team tracking campaigns across multiple locations, TapClicks centralizes your most critical KPIs and updates them in real time.
But TapClicks goes far beyond static reporting. The platform’s AI analytics engine automatically uncovers trends, anomalies, and actionable insights from your campaign data, eliminating hours of manual analysis. With features like SmartEmail, stakeholders can receive automated, AI-curated insights directly in their inbox, ensuring that everyone—from account managers to C-suite executives—stays informed and proactive.
Workflow automation is another cornerstone of the TapClicks experience. Order management, approval flows, and role-based access make it easy for teams to collaborate, fulfill requests, and maintain consistency across all client or campaign reports. TapClicks also offers sophisticated ROI visualization tools, helping marketers not only track spend and performance but clearly demonstrate the impact of every dollar invested.
Whether you need to deliver detailed client KPI reporting, empower internal analytics teams, or generate executive-level summaries, TapClicks streamlines the entire process—from data integration to final presentation. For a deeper dive into how TapClicks accelerates advanced analytics and reporting, check out "Unlock AI Analytics Fast with TapClicks".
Experience firsthand how TapClicks can transform your reporting workflows and deliver clearer ROI insights by visiting TapClicks.
Best Practices for Setting Up an Automated Marketing Insights Dashboard
Building an automated marketing insights dashboard isn’t just about plugging in data—it’s about creating a dynamic decision-making tool tailored to your organization’s unique goals. Here’s how to set up a dashboard that delivers ongoing value, clarity, and actionable insights:
1. Choose the Right KPIs for Your Goals
Start by identifying the most meaningful KPIs for your business or clients. Focus on metrics that tie directly to campaign objectives, business outcomes, and client expectations—whether it’s lead generation, cost per acquisition, return on ad spend, or engagement rates. Avoid dashboard clutter by prioritizing actionable indicators over vanity metrics.
2. Customize Visualizations for Clarity
Leverage customizable visual elements—such as trend lines, conversion funnels, geo heatmaps, and pie charts—to present data in the most digestible format for your stakeholders. TapClicks’ drag-and-drop dashboard makes it easy to tailor visualizations to different audiences, from granular analyst views to executive summaries. Consider user roles and reporting needs when designing layouts, ensuring everyone gets the insights most relevant to them.
3. Set Up Automated Alerts and Scheduled Reporting
Take advantage of automated alerts to flag anomalies, threshold breaches, or sudden shifts in campaign performance. Proactive notifications empower teams to act fast, minimizing wasted spend or missed opportunities. With TapClicks, you can schedule recurring reports and SmartEmail updates, ensuring stakeholders receive timely insights without manual intervention.
4. Integrate Data Sources for a Unified View
Seamlessly connect all relevant marketing, advertising, and business data sources. Use data connectors and enrichment tools to blend information across platforms—think Google Ads, Facebook, CRM, and offline channels—creating a centralized source of truth. TapClicks supports integrations with 10,000+ platforms, making unified analytics simple and scalable.
5. Onboard Teams and Clients Effectively
Introduce your dashboard to internal teams and clients through guided walkthroughs, role-based access, and training resources. Set clear expectations on how to read, act on, and share insights. Empower users with self-serve reporting, but offer support for advanced analytics or troubleshooting as needed.
6. Optimize and Maintain Your Dashboard
View your dashboard as a living asset. Regularly review KPIs, add new data sources, and update visualizations as business priorities evolve. Solicit feedback from end users to identify areas for improvement. Scheduled audits and ongoing optimization ensure your dashboard remains accurate, relevant, and aligned with strategic goals.
For more on designing and deploying high-impact dashboards, see the "TapClicks AI Platform Guide". Following these best practices will help you unlock the full power of automated marketing reporting—and keep your teams focused on growth, not grunt work. For a deeper dive into TapClicks’ unified approach, you can explore the official TapClicks website.
Measuring Success: From Metrics to Marketing Impact
The true power of an automated KPI reporting dashboard isn’t just in presenting numbers—it’s in translating those numbers into meaningful action and business growth. With real-time, AI-enhanced dashboards, marketing teams move beyond static spreadsheets and instead gain a living view of campaign health, budget pacing, and ROI. But how do you ensure your dashboard is driving actual impact and not just reporting activity?
The first step is to interpret metrics within context. For example, a spike in click-through rates is only valuable if it leads to conversions or supports your broader campaign objectives. TapClicks’ AI analytics reporting automatically surfaces these correlations, highlighting which KPIs are genuinely moving the needle—and why. Instead of sifting through endless charts, teams receive prioritized insights, such as underperforming channels, budget anomalies, or standout creative assets, delivered directly through features like SmartEmail.
Actionable insights are essential for optimization. Imagine an agency monitoring multi-client campaigns: TapClicks can reveal that a specific ad set is lagging behind benchmarks, trigger an automated alert, and even recommend budget reallocation based on predictive models. For enterprise brands managing dozens of locations, dashboards can instantly unify performance data, spotlighting which regions need attention and which are exceeding expectations.
Continuous improvement is the hallmark of high-performing marketing teams. Automated dashboards make it easy to A/B test creative, adjust targeting, and track the results in near real-time. Over time, the ability to benchmark against historical data and industry standards—features built into platforms like TapClicks—enables marketers to refine strategies with confidence and agility.
Ultimately, the goal is to turn raw metrics into demonstrable marketing impact. With the right dashboard, teams don’t just report on KPIs—they use them to justify investment, align stakeholders, and fuel ongoing growth. By leveraging the advanced AI insights and workflow automation of TapClicks, organizations can move from reactive reporting to proactive, data-driven decision-making—ensuring that every marketing effort is measured, optimized, and maximized for business success.
Conclusion
An automated KPI reporting dashboard is more than just a reporting tool—it’s a strategic advantage that transforms the way marketing teams operate. By centralizing data, automating performance tracking, and surfacing real-time insights, platforms like TapClicks empower marketers to focus on what truly matters: optimizing campaigns, proving ROI, and making smarter decisions at scale. The result is not only significant time savings and increased reporting accuracy but also a new level of agility in responding to market changes and client needs.
Whether you’re an agency managing dozens of clients or a brand overseeing multi-channel campaigns, embracing automated KPI reporting is key to elevating your marketing operations. TapClicks stands out with its unified platform, AI-powered analytics, and robust workflow automation—making it the ideal solution for teams ready to streamline reporting and unlock actionable insights.
Ready to see the difference for yourself? Explore TapClicks to discover how easy it is to build, customize, and automate your marketing dashboards. Start a free trial or schedule a demo today, and experience the future of data-driven marketing firsthand.
Start Automating Your Marketing Data Today!
No Credit Card Required.

