

Automated KPI Reporting Dashboard: Real-Time Marketing Insights
Manual data wrangling and spreadsheet updates shouldn’t stand between you and actionable marketing insights. An automated KPI reporting dashboard gives marketing teams instant access to performance data, campaign trends, and ROI—without hours of copy-pasting or human error. With TapClicks, marketers can unify cross-channel metrics, leverage AI-powered analytics, and automate client-ready reports, all in one intuitive platform. This guide explores how automated dashboards transform decision-making, save time, and elevate the value of marketing analytics for agencies, brands, and enterprise teams.
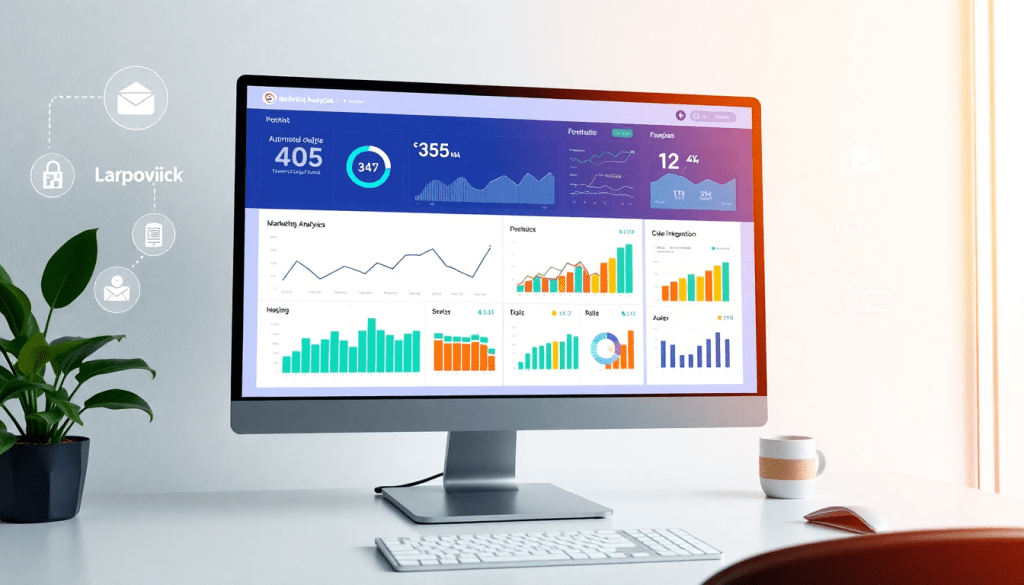
What is an Automated KPI Reporting Dashboard?
An automated KPI reporting dashboard is a dynamic, centralized platform that continuously gathers, analyzes, and visualizes key performance indicators (KPIs) from multiple marketing channels—without the need for manual intervention or spreadsheet updates. Unlike static reports or manual data compilation, automated dashboards connect directly to your marketing data sources (such as ad platforms, analytics tools, and CRMs), aggregating information in real time. This enables marketers to track campaign performance, budget pacing, ROI, and engagement metrics at a glance, all through customizable visualizations and scheduled reports.
Traditional reporting methods often rely on time-consuming processes: exporting CSVs, copy-pasting numbers, and manually updating charts. These approaches introduce the risk of human error, inconsistencies, and out-of-date insights. In contrast, an automated KPI reporting dashboard eliminates these bottlenecks by streamlining data collection, standardizing metrics across channels, and providing up-to-the-minute analytics—empowering marketing teams to act on insights faster and with greater confidence.
TapClicks stands out as a leading solution in this space, offering a robust platform specifically designed for marketing KPI automation. With TapClicks, users can unify cross-channel data, leverage AI-powered analytics, and automate report delivery to stakeholders or clients. The platform’s advanced capabilities go beyond simple data visualization, surfacing actionable insights and recommendations that drive results at scale. For a deeper dive into how TapClicks transforms marketing analytics, visit the TapClicks Automated KPI Reporting Dashboard overview.
Why Automating Your Marketing KPIs Is a Game-Changer
Automating KPI reporting isn’t just about convenience—it’s about unlocking new levels of productivity, accuracy, and impact for marketing teams. Here’s how automated reporting with platforms like TapClicks transforms your marketing operations:
1. Reclaim Valuable Time
- No more manual spreadsheets: Say goodbye to tedious data pulls, copy-pasting, and endless formatting.
- Hands-off updates: Scheduled, automated dashboards mean fresh data is always at your fingertips.
- Massive time savings: Many TapClicks clients report saving 50+ hours per analyst, every month—time that’s redirected toward strategy, analysis, and campaign innovation.
2. Trustworthy, Consistent Data
| Manual Reporting | Automated Reporting with TapClicks |
|---|---|
| Prone to human error | Direct source system integration |
| Inconsistent metric formats | Normalized, reliable data every time |
| Version confusion | Single source of truth for all teams |
- No more discrepancies: Automated workflows eliminate the risk of manual entry errors.
- Data everyone can trust: From account leads to executives, stakeholders get numbers they know are accurate.
3. Faster Insights, Smarter Decisions
- Real-time dashboards: Spot trends, anomalies, and opportunities as they happen.
- Agile optimization: Adjust campaigns and budgets on the fly—no waiting for end-of-month reports.
- Proactive strategy: Make data-driven decisions that improve ROI and resource allocation.
4. Professional, Branded Client Reporting
- Automated report delivery: TapClicks generates and distributes client-ready, on-brand reports on a recurring schedule.
- Self-serve access: Clients and internal teams can view up-to-date performance metrics anytime.
- Enhanced transparency: Builds trust and strengthens relationships with clients and stakeholders.
In short:
Automating your marketing KPI reporting turns reporting from a tedious chore into a strategic asset—empowering teams to focus on what actually moves the needle.
What to Expect from a Real-Time Performance Dashboard
Choosing a real-time performance dashboard isn’t just about seeing your data—it’s about transforming it into instant, actionable insights. Here’s what sets a high-impact marketing dashboard apart, and how to spot the features that matter most.
Bring All Your Data Together—No More Silos
A truly effective dashboard should:
- Unify all your channels: Social, paid media, SEO, CRM, and more
- Offer extensive native connectors: (TapClicks provides access to 10,000+)
- Enable custom integrations: So you never miss a data source or get stuck with partial views
Why it matters:
No more jumping between platforms or piecing together spreadsheets—everything is in one place, always up to date.
Let AI Do the Heavy Lifting
The best dashboards don’t just show numbers—they interpret them for you. With AI-powered analytics and reporting, your platform should:
- Instantly surface trends, anomalies, and optimization opportunities
- Generate actionable insights for every campaign
- Automate performance scoring and recommendations
TapClicks example:
AI Agents and SmartPilot features turn raw data into clear, practical next steps, so you can improve results on the fly.
Customize Dashboards Your Way
Every team—and every client—has unique needs. Look for:
- Drag-and-drop editing: Build your own views in seconds
- Flexible chart types and widgets: Tailor reporting to your audience
- Branded dashboards: Keep presentations on-message and professional
With TapClicks, you get full control to design dashboards that make impact—no coding required.
Automate Reports and Save Hours Every Week
Stop spending time on manual updates. Your dashboard should:
- Schedule reports: Deliver insights daily, weekly, or monthly—automatically
- Handle email distribution: Send to teams and clients with zero manual effort
- Refresh data: Ensure every report is always current
Bonus:
TapClicks can cut reporting workloads by over 50 hours per analyst per month.
Track Everything, for Every Client and Channel
Whether you’re an agency juggling dozens of accounts, or a brand with multiple locations, you need:
| Feature | Why It Matters |
|---|---|
| Cross-channel tracking | Unified view of Google, Meta, LinkedIn, and more |
| Multi-client management | Scale reporting without losing accuracy or privacy |
| Role-based access | Right info, right people, every time |
| White-labeling | Deliver dashboards under your own brand |
Why TapClicks?
TapClicks blends all these must-haves into one platform—so you can focus on marketing, not manual reporting.
- Explore more: Automated KPI Reporting Dashboard Guide
- Ready to unify your analytics? See how TapClicks transforms ops at scale
Bottom line:
The right dashboard doesn’t just report data. It empowers your team to act faster, scale smarter, and deliver results clients love. TapClicks brings it all together—so your reporting is always one step ahead.
How Automated Dashboards Supercharge Data-Driven Marketing
Automated KPI reporting dashboards are more than just a convenience—they’re the engine powering agile, insight-driven marketing. By giving teams instant access to unified, real-time data, these dashboards enable smarter, faster, and more strategic decision-making.
Why Automated Dashboards Matter
Here’s how automated dashboards, especially those powered by TapClicks, transform marketing operations:
- Real-Time Campaign Visibility:
Instantly track impressions, clicks, conversions, CPA, and more—across every channel, updated as data flows in. - Proactive Decision-Making:
Identify trends and anomalies the moment they appear, allowing for on-the-fly optimizations. - Cross-Channel Performance Analytics:
View all your campaign metrics from Google Ads, Facebook, programmatic, and more in one unified dashboard.
Example: From Siloed Data to Unified Insights
Traditional Approach:
- Wait for end-of-month reports
- Manually assemble data from multiple platforms
- React to underperformance after the fact
With TapClicks Automated Dashboards:
- All KPIs in One Place:
Impressions, clicks, conversions, CPA, and more—automatically pulled and visualized. - Instant Channel Comparison:
See at a glance which platforms outperform others. - Immediate Budget Reallocation:
Shift spend based on real-time results, not outdated reports.
Unlocking the Power of AI Insights
TapClicks goes beyond dashboard basics with built-in AI and automation:
- AI Agents:
Continuously analyze data to uncover actionable recommendations—like detecting overspending, spotting engagement drops, or benchmarking against industry standards. - SmartPilot & SmartEmail:
Automatically deliver insights and summaries to stakeholders via email, so no key trend gets missed.
Designed for Scale and Transparency
For agencies and multi-client organizations, TapClicks makes it easy to manage reporting at scale:
| Feature | Benefit |
|---|---|
| Role-Based Access | Clients see only their data; teams see the big picture |
| Branded Dashboards | Professional, client-ready views for every account |
| Aggregate Monitoring | Track ROI across hundreds of campaigns and clients |
What This Means for Your Team
- Move from static data to dynamic strategy.
- Act on insights, not just information.
- Build trust with transparent, real-time reporting.
With TapClicks automated dashboards, your marketing data becomes a living asset—one that empowers you to optimize spend, maximize ROI, and deliver measurable results with confidence.
Learn more about TapClicks
Building and Customizing Your Marketing Insights Dashboard
Creating an effective automated KPI reporting dashboard starts with three core steps: connecting your data sources, selecting your key performance indicators (KPIs), and designing reports that deliver clarity to every stakeholder. With TapClicks, this process is streamlined and scalable, empowering marketing teams to quickly move from raw data to actionable insight—no matter the campaign complexity or audience.
Step 1: Connect Your Data Sources
Begin by pulling in your marketing, advertising, and business data. TapClicks offers over 10,000 connectors—covering everything from Google Ads and Facebook to programmatic channels and CRM platforms—so you can unify all performance metrics in one place. Setting up integrations is simple: authenticate your accounts, map your fields, and let TapClicks’ automated ETL pipelines handle data extraction, transformation, and loading. This ensures your dashboard always reflects the latest campaign activity, free from manual imports or spreadsheet headaches.
Step 2: Select and Define KPIs
A powerful dashboard is only as good as the KPIs it tracks. Work with your team to identify the most meaningful metrics for your goals—think clicks, conversions, ROAS, cost per acquisition, or custom channel-specific measures. TapClicks allows you to blend, normalize, and enrich data across platforms, enabling apples-to-apples reporting on multi-channel campaigns or multi-location brand performance. Use built-in templates for common KPIs, or configure custom formulas to match your unique strategies.
Step 3: Design Reports and Visualizations
With your data connected and KPIs defined, it’s time to build dashboards tailored to your audience. TapClicks’ drag-and-drop interface makes it easy to create clear, branded visualizations—line graphs for trends, pie charts for share of spend, tables for granular detail. You can set up dashboards for internal teams, executive summaries, or client-facing reports, each with role-based permissions and white-label branding. Schedule automated report delivery or provide real-time access, ensuring everyone gets the right insight at the right time.
Tailoring Dashboards for Different Audiences
- Executives: Focus on high-level results, ROI, and strategic pacing. Use summary widgets and predictive insights.
- Clients: Highlight campaign progress, budget utilization, and key wins. Emphasize clarity and transparency with easy-to-understand visuals.
- Channel Managers: Deliver granular performance breakdowns, channel comparisons, and actionable optimization recommendations.
Best Practices for Scalable, Automated Analytics Workflows
- Standardize data mapping across accounts to enable cross-client or cross-brand reporting at scale.
- Leverage scheduled delivery and SmartEmail features to automate stakeholder communications and reduce manual follow-ups.
- Iterate and evolve dashboards as new KPIs, channels, or business priorities emerge—TapClicks makes it easy to update templates or add new data streams without starting from scratch.
By following these steps and best practices, you empower your team to deliver real-time, customized marketing insights—maximizing the impact of every campaign. To learn more about building dashboards that fit your business, explore the TapClicks platform and discover how easy automation can be.
TapClicks in Action: Automated Reporting Use Cases
The true power of an automated KPI reporting dashboard is best illustrated through real-world applications—and TapClicks excels across a variety of marketing environments. Here’s how organizations from agencies to enterprise brands are leveraging TapClicks to transform their reporting, streamline operations, and boost performance outcomes.
1. Agency Client Reporting at Scale
Marketing agencies often juggle hundreds of client accounts, each demanding timely, tailored performance reports. With TapClicks, agencies automate the entire reporting cycle—integrating data from 10,000+ sources, customizing dashboards for each client, and scheduling branded reports for effortless delivery. This automation not only slashes analyst workloads (saving up to 50+ hours per month per analyst) but also enhances accuracy and consistency, leading to higher client satisfaction and retention. Agencies are empowered to focus on campaign strategy, while TapClicks handles the heavy lifting of data wrangling and insight generation.
2. Multi-Location Brand Analytics
For brands with multiple locations or franchises, consolidating performance data across regions is a notorious challenge. TapClicks simplifies this by automatically aggregating cross-channel, multi-location data into unified dashboards. Marketing teams gain immediate visibility into which regions, channels, or campaigns are over- or under-performing—enabling rapid, data-driven adjustments and budget reallocations. The result: improved ROI and a streamlined approach to managing complex, distributed marketing efforts.
3. Enterprise Performance Monitoring
Enterprises require robust, scalable solutions capable of handling high data volumes and complex analytics needs. TapClicks acts as the central marketing intelligence hub, feeding cleaned and normalized data into dashboards, BI tools, and other downstream systems. Enterprise teams use TapClicks to monitor campaign effectiveness, manage budgets, and surface AI-driven insights across departments or business units. This holistic view drives faster decision-making and ensures alignment between sales, marketing, and finance stakeholders.
Proven Results: Time Savings, Accuracy, and Impact
Organizations using TapClicks consistently report dramatic time savings, reduced manual errors, and more actionable insights. For a deeper look at how TapClicks customers unlock AI-powered analytics and accelerate their reporting workflows, check out the Unlock AI Analytics Fast with TapClicks fast-start guide.
Ready to see how TapClicks can streamline your reporting and deliver real-time marketing insights? Explore more at tapclicks.com.
Choosing the Right Automated Analytics Solution
With the growing demand for real-time marketing insights, selecting the best automated KPI reporting dashboard is a mission-critical decision for agencies, brands, and enterprise teams. The marketplace is crowded with options—ranging from lightweight reporting tools to robust, enterprise-grade platforms—so it’s essential to understand how leading solutions compare and which features will future-proof your marketing operations.
TapClicks stands out for its ability to unify data integration, AI-powered analytics, and workflow automation at scale. Unlike point tools such as Agency Analytics or NinjaCat, which are designed for simpler use cases, or pure data connectors like Funnel.io and Supermetrics, TapClicks delivers a truly end-to-end platform. It combines over 10,000 marketing and business data connectors, automated ETL/ELT pipelines, AI-driven insights, and customizable reporting—all within a single, intuitive interface.
When evaluating automated analytics solutions, consider these five key factors:
- Scalability: Can the platform handle your current and future reporting volumes—hundreds or thousands of dashboards, clients, and campaigns—without performance bottlenecks? TapClicks is architected for high-volume use, making it ideal for agencies and multi-location brands.
- Integration Options: Look for support for a wide array of marketing, advertising, and business data sources. TapClicks’ Smart Connectors and data enrichment tools ensure seamless integration, whether you’re pulling from social, search, programmatic, CRM, or offline sources.
- AI Capabilities: Does the platform simply visualize data, or does it surface actionable insights? TapClicks offers built-in AI agents that automatically analyze dashboards, flag anomalies, and generate predictive recommendations—helping you move from data to decision faster.
- Client Access and Collaboration: Role-based permissions, white-labeling, and automated delivery are essential for agencies and media companies managing multiple clients. TapClicks simplifies client reporting through branded portals and scheduled insights.
- Support and Flexibility: Responsive onboarding, technical support, and the ability to export cleansed data to BI tools like Tableau or Power BI are critical for enterprise adoption.
Before committing, take advantage of platform demos or pilot programs to test real-world workflows, data connections, and reporting outputs. Most vendors, including TapClicks, offer guided walkthroughs and trial access so you can evaluate ease of use, customization capabilities, and the overall impact on your marketing operations.
Choosing the right automated analytics solution is about more than just dashboards—it’s about building a scalable, insight-driven marketing engine. Explore how TapClicks can centralize your data, automate your reporting, and empower your team to make smarter, faster decisions by visiting TapClicks.
Future Trends in Automated KPI Reporting
The landscape of automated KPI reporting is evolving at a breakneck pace, driven by rapid advancements in AI and the ever-increasing demand for deeper, faster marketing insights. Modern platforms are no longer just about aggregating numbers—they’re about delivering predictive analytics, personalized recommendations, and smart reporting that proactively guides strategy.
AI-powered analytics are at the forefront of this transformation. Next-generation dashboards, like those found in TapClicks, now feature customizable AI agents that automatically sift through massive datasets to surface hidden trends, anomalies, and opportunities. These agents can generate plain-language insight summaries and even email them directly to stakeholders, making it easier than ever to keep teams and clients informed in real time.
Predictive modeling is another game-changer. Marketers can now go beyond retrospective performance tracking and leverage AI-driven forecasts for budget pacing, conversion likelihood, and ROI optimization. This shift enables proactive decision-making and agile campaign management, reducing wasted spend and amplifying results.
Seamless system integration is becoming the new standard. Automated KPI dashboards increasingly connect not only to marketing channels but also to BI tools, CRMs, and finance platforms, creating a unified, organization-wide view of performance. This holistic approach streamlines reporting for multi-location brands, agencies, and enterprise teams, eliminating data silos and manual data wrangling.
Looking ahead, the future of automated KPI reporting is smart, integrated, and actionable. Platforms like TapClicks are leading the way with innovations such as AI-driven media mix modeling, workflow automation, and role-based access for multi-client environments. As the industry moves toward more robust automation and intelligence, marketers can expect to spend less time on manual tasks and more time on strategy and growth.
Curious about what’s next for marketing analytics? Explore the latest advancements and roadmap from TapClicks to stay ahead of the curve.
Start Automating Your Marketing Data Today!
No Credit Card Required.

