

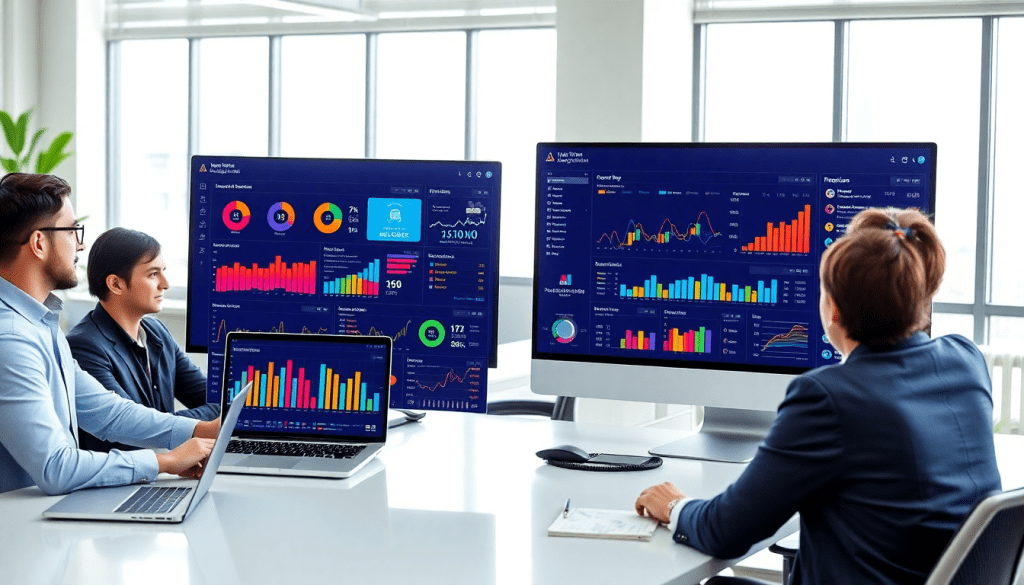
Automated KPI Reporting Dashboard: Real-Time Marketing Insights
Modern marketing teams need more than static spreadsheets—they need automated, real-time insights that unify all their KPIs across campaigns, clients, and channels. An automated KPI reporting dashboard brings together AI analytics, intuitive visualization, and workflow automation, letting marketers focus on strategy instead of manual reporting. This guide explores how to leverage platforms like TapClicks to streamline marketing KPI automation, optimize performance, and deliver actionable insights to stakeholders and clients.
What Is an Automated KPI Reporting Dashboard?
An automated KPI reporting dashboard is a dynamic platform that consolidates, visualizes, and analyzes key performance indicators (KPIs) across all marketing activities in real time—removing the need for manual spreadsheet updates or siloed reporting. At its core, this type of dashboard serves as the nerve center of modern marketing operations, giving teams a centralized view of campaign performance, channel metrics, and business outcomes.
The shift from static, manual spreadsheets to real-time, AI-powered dashboards represents a major evolution in how marketers operate. Manual processes are time-consuming, error-prone, and can’t keep pace with the speed of today’s digital campaigns. Automated dashboards, on the other hand, pull data from multiple sources, process it through automated workflows, and present insights in customizable visualizations—often with AI-driven recommendations layered on top.
Key features of an automated KPI reporting dashboard include marketing KPI automation (so the latest metrics are always on hand), seamless cross-channel data integration (to unify analytics from social, search, display, and more), and workflow automation that streamlines the entire reporting process. Leading platforms like TapClicks take this even further by offering scalable multi-client management, AI-powered insights, and automated report delivery, freeing marketers to focus on strategy and optimization rather than data wrangling.
For a deeper dive into how dashboard automation and analytics tools are transforming marketing reporting, check out this overview of dashboard automation and analytics tools.
Benefits of Real-Time Performance Dashboards
For modern marketing teams and agencies, real-time performance dashboards are more than a convenience—they are a strategic necessity. Automating KPI reporting saves valuable hours otherwise spent wrangling spreadsheets or manually assembling data from disparate platforms. With a real-time dashboard, campaign metrics are continuously updated and aggregated, ensuring that everyone from analysts to account managers operates with the most current information at their fingertips.
This immediacy translates directly to improved decision-making. Instead of waiting days or weeks for manual reports, teams can proactively identify underperforming channels or budget overruns as they happen. Whether it’s reallocating spend mid-campaign to capitalize on a surge in conversions, or diagnosing a drop in engagement before it impacts results, these dashboards empower marketers to act swiftly and with confidence.
The impact on campaign optimization and ROI visualization is profound. Automated marketing metrics illuminate which efforts are driving results—and which need adjustment—enabling agencies to fine-tune strategies in real time. For example, a multi-location brand using a real-time dashboard can instantly compare performance across regions, rapidly sharing best practices from top-performing locations or troubleshooting where support is needed most. Agencies managing dozens or hundreds of clients benefit from scheduled, error-free reporting that delights stakeholders and frees up team capacity for higher-value activities.
Ultimately, the shift to automated KPI dashboards improves not just efficiency, but outcomes. By surfacing actionable insights and streamlining workflows, marketing teams are better equipped to demonstrate value, optimize spend, and deliver measurable business impact. To learn more about how dashboard automation transforms marketing operations, see this overview of dashboard automation and analytics tools.
Essential Features for a Modern Marketing Insights Dashboard
To truly empower marketing teams and agencies, a modern KPI reporting dashboard must go far beyond basic charts and tables. The right platform centralizes every crucial data point and streamlines insight delivery, making marketing analytics not just accessible, but actionable. Here are the essential features to look for:
1. Unified Data Connectors:
At the heart of any advanced dashboard is its ability to integrate data seamlessly from all your marketing platforms—search, social, display, email, CRM, and more. TapClicks, for example, offers over 10,000 data connectors, making it simple to unify metrics across every client, campaign, and location. This ensures that your dashboards always reflect the most current, comprehensive view of your performance.
2. Customizable Widgets and Visualizations:
No two marketing teams have the same reporting needs. The ability to drag-and-drop widgets, build custom visualizations, and tailor dashboards for different stakeholders is essential. Whether you’re tracking digital campaign KPIs, budget pacing, or ROI by channel, customizable interfaces let you focus on what matters most to your team and your clients. For inspiration, see these visual KPI dashboard examples.
3. AI Analytics and Automated Reporting:
Dashboards should do more than display numbers—they should help you interpret them. Modern platforms leverage AI agents to surface trends, detect anomalies, and even deliver optimization recommendations directly within your dashboard. With tools like TapClicks SmartPilot and TapInsights, teams gain proactive insights instead of reactive analysis, accelerating decision-making and campaign refinement.
4. Automated Scheduling and Delivery:
Automated marketing metrics are only valuable if they reach the right people at the right time. Look for dashboards with built-in scheduling, so reports and insights can be automatically delivered to internal teams or clients—daily, weekly, or on-demand. This eliminates tedious manual work and ensures stakeholders are always in the loop.
Why These Features Matter:
A dashboard that combines unified data, customization, AI-driven insights, and automated delivery supports true digital campaign KPI tracking. Marketers get a single source of truth, freeing up time for strategic work, while clients receive timely, transparent performance updates.
TapClicks’ Unique Strengths:
Unlike many point solutions, TapClicks is built for scale—handling thousands of dashboards and clients without performance slowdowns. Its AI-driven analytics, flexible reporting tools, and robust automation set it apart in a crowded market, making it a trusted partner for agencies, media companies, and enterprise brands. Learn more about TapClicks and how it can power your marketing insights.
How Automated Analytics Workflows Streamline Reporting
Manual reporting is a notorious bottleneck for marketing teams—prone to errors, time-consuming, and often outdated by the time stakeholders review results. Automated analytics workflows resolve these challenges by transforming the end-to-end reporting process into a seamless, error-resistant pipeline.
At the core of automation is a structured flow: data from disparate marketing platforms is integrated and cleansed, transformed into standardized formats, and then visualized in intuitive dashboards. With platforms like TapClicks, this process is fully automated. Marketers no longer have to chase down multiple logins, wrangle spreadsheets, or risk copy-paste mistakes. Instead, TapClicks’ robust data connectors import campaign, budget, and performance data from over 10,000 sources, while built-in enrichment tools normalize and blend multi-channel datasets.
Once data is unified, automated workflows kick in—generating dynamic reports and dashboards that update in real time. Marketers can schedule these reports for internal review or direct distribution to clients, ensuring everyone receives timely, accurate insights without manual intervention. Tools like TapClicks also support advanced client KPI reporting, where granular access controls and branded dashboards deliver exactly the right view to each stakeholder.
By automating analytics workflows, organizations not only save hundreds of hours per month but also dramatically reduce reporting errors and inconsistencies. The result: more time for strategic analysis, faster responses to performance trends, and a higher standard of service for clients.
For a deeper dive into how TapClicks leads the way in reporting automation for marketers, explore their platform’s capabilities and see how automated workflows can unlock efficiency and accuracy at scale.
Cross-Channel Performance Analytics: Unifying Your Data
One of the biggest challenges facing modern marketers is stitching together performance data from a sprawling array of channels—search, social, display, video, email, and more—each with its own metrics, formats, and reporting standards. Without a unified view, teams risk missing critical insights, duplicating efforts, or making decisions based on incomplete information.
This is where cross-channel performance analytics and data-driven marketing dashboards become game-changers. By consolidating disparate data streams into a single source of truth, marketers can see the full picture: how campaigns interact, where budget delivers the best ROI, and which channels drive conversions at every stage of the funnel. A truly integrated dashboard not only reveals what’s working and what’s not, but also enables teams to optimize spend and strategy in real time.
TapClicks stands out in this arena, offering over 10,000 pre-built connectors—including all major ad platforms, analytics tools, and business data sources. Combined with advanced enrichment and normalization tools, TapClicks ensures that data from every channel is blended accurately for cross-channel and multi-location reporting. This means agencies and multi-location brands can track campaign performance across dozens—or even hundreds—of accounts, markets, or clients, all within a single, intuitive interface.
The result? Faster insights, cleaner attribution, and more confident decision-making—whether you’re managing a handful of digital campaigns or orchestrating omnichannel strategies at scale. By embracing unified analytics, marketers can finally move beyond fragmented spreadsheets and into a world where data drives every action. To see how TapClicks empowers this transformation, explore their reporting automation for marketers.
Delivering Actionable Insights to Clients and Stakeholders
The true value of an automated KPI reporting dashboard lies not just in aggregating data, but in its ability to translate numbers into actionable insights for clients and stakeholders. Modern platforms equipped with AI analytics reporting—like TapClicks—automatically analyze campaign data to surface trends, identify optimization opportunities, and generate tailored recommendations. This means marketers can move beyond basic performance summaries and deliver meaningful, forward-looking guidance that drives business outcomes.
Customizable dashboards ensure that every client or stakeholder receives the information that matters most to them. Whether it’s a CMO seeking high-level ROI visualization or an account manager needing granular campaign performance, TapClicks empowers users to create branded, role-specific views that highlight key KPIs, trends, and benchmarks. This level of personalization not only enhances client satisfaction but also facilitates transparent, data-driven conversations.
When it comes to presenting ROI and campaign outcomes, best practices include leveraging dynamic visualizations—such as trend lines, conversion funnels, and budget pacing charts—to clearly illustrate impact and progress. With TapClicks’ intuitive reporting studio, these visualizations can be easily arranged and annotated, helping stakeholders quickly grasp both successes and areas for improvement. This approach transforms complex data into compelling stories that support strategic decisions.
Sharing insights is effortless with TapClicks’ automated report scheduling and SmartEmail features. Stakeholders receive timely, AI-curated summaries directly in their inboxes, eliminating the need for manual follow-ups or static exports. Teams can set up recurring distributions—for both internal leadership and external clients—ensuring everyone stays aligned and informed without additional administrative work. To see how automated reporting can elevate your client communications, explore how TapClicks leads in reporting automation for marketers.
In short, an automated KPI reporting dashboard powered by AI and built for customization enables marketing teams to deliver insights that are not only timely, but truly actionable—fostering trust, optimizing campaigns, and demonstrating clear value to every stakeholder.
Choosing the Right Automated KPI Reporting Solution
Selecting the ideal automated KPI reporting dashboard for your organization is a pivotal decision—one that impacts your team’s efficiency, data accuracy, and ability to deliver real results for clients or stakeholders. As the marketing technology landscape continuously evolves, here are the essential criteria to consider:
1. Scalability:
Your chosen solution should comfortably handle your current data volume and seamlessly expand as your client roster or campaign complexity grows. Platforms like TapClicks are engineered for scale, supporting thousands of dashboards and reports, making them a strong fit for agencies, media companies, and multi-location brands that require robust multi-client management.
2. AI Capabilities:
Modern marketing dashboards go beyond static reporting. Look for platforms that embed AI analytics, such as automated insights, predictive modeling, and anomaly detection. TapClicks stands out with its AI-driven SmartPilot and SmartEmail features, which proactively surface optimization opportunities and deliver concise, actionable summaries directly to your team or clients.
3. Integration Options:
A dashboard’s value hinges on its ability to connect all your marketing and business data sources. Comprehensive integration libraries—like TapClicks’ 10,000+ connectors—ensure you can blend, normalize, and analyze data across search, social, display, email, CRM, and more, without time-consuming manual exports or custom development.
4. User Experience and Customization:
From drag-and-drop dashboard builders to flexible widget libraries and branded reporting studios, a solution’s usability impacts adoption and productivity. Prioritize platforms that empower both technical and non-technical users to create, customize, and share insights effortlessly.
5. Automated Workflows and Reporting:
Automation isn’t just about data pulls—it should extend to report scheduling, delivery, and campaign workflow integration. TapClicks, for example, offers robust workflow automation, centralized order management, and role-based access, streamlining the entire reporting lifecycle.
6. Business Impact:
Ultimately, your dashboard should make it easier to visualize ROI, optimize budgets, and drive better marketing outcomes. Evaluate how each solution supports both granular analytics and big-picture decision-making—does it simply display data, or does it drive action with timely, contextual insights?
Comparing Leading Solutions
While point tools like Funnel.io and Supermetrics are strong at piping raw data, they often lack the unified reporting, workflow, and AI-driven insight capabilities needed for true marketing operations at scale. Agency Analytics and NinjaCat cater to smaller teams but may fall short on enterprise-grade customization or integrations. Datorama (Salesforce) offers deep analytics but can be complex and cost-prohibitive for mid-market teams.
TapClicks differentiates itself by combining the breadth of data connectivity with scalable reporting, workflow automation, and actionable AI insights—all within a single, intuitive platform. This unified approach reduces tech sprawl, streamlines operations, and maximizes the value of your marketing data.
Evaluating the Right Fit
When choosing your automated KPI reporting dashboard, involve both your technical and business stakeholders in the evaluation process. Pilot dashboards, request demos, and map features to your workflow requirements to ensure the solution delivers measurable time savings, deeper insights, and a clear return on investment.
Conclusion
Automated KPI reporting dashboards are fundamentally transforming how marketers operate, replacing manual, time-consuming reporting with real-time insights, unified data, and AI-driven analytics. By centralizing campaign metrics, automating analytics workflows, and delivering actionable recommendations, these dashboards empower teams to focus on strategy and optimization rather than data wrangling. Platforms like TapClicks stand out by offering unmatched scale, powerful AI insights, and seamless integrations—giving marketing teams and agencies the tools they need to deliver exceptional results for clients and stakeholders.
Ready to transform your marketing operations? Explore TapClicks for automated reporting, cross-channel analytics, and real-time marketing insights. Schedule a demo or start with a pilot dashboard to see how streamlined KPI automation can unlock new levels of efficiency, clarity, and growth for your organization.
Start Automating Your Marketing Data Today!
No Credit Card Required.

