

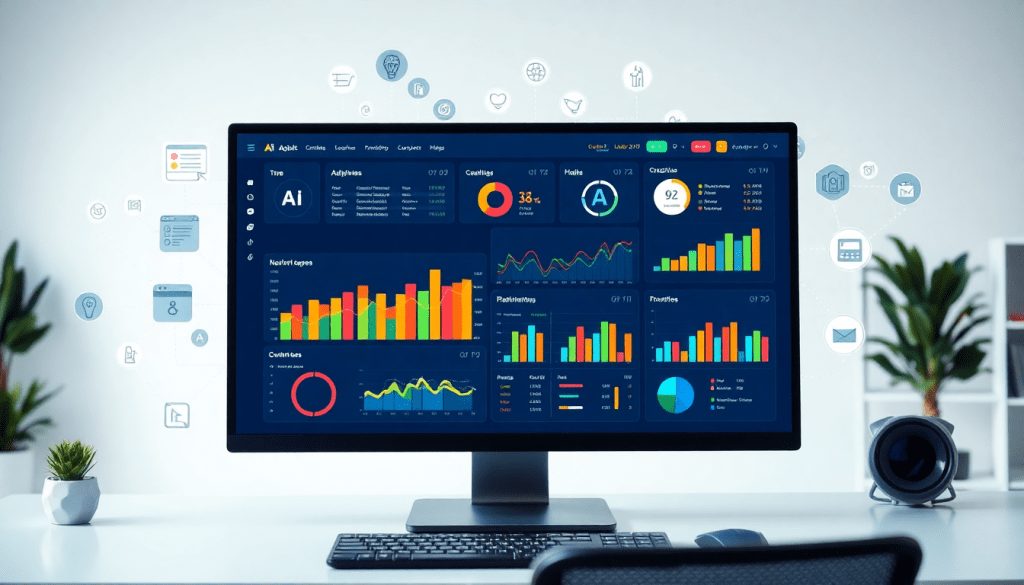
Automated KPI Reporting Dashboard: Real-Time Marketing Insights
An automated KPI reporting dashboard transforms how marketers track, analyze, and communicate campaign results. With real-time performance dashboards, AI analytics, and cross-channel data integration, teams can shift from hours of manual reporting to instant, actionable insights. TapClicks delivers marketing KPI automation at scale, empowering agencies, brands, and enterprises to unify their metrics, visualize ROI, and optimize strategy—all in a single, automated platform. Here’s how to unlock the next level of data-driven marketing with the right dashboard solution.
What Is an Automated KPI Reporting Dashboard?
An automated KPI reporting dashboard is a must-have digital tool for modern marketing teams. It streamlines the way you collect, unify, and visualize your key performance indicators—without the headaches of manual reporting or static spreadsheets.
What Makes Automated Dashboards Different?
Here’s how automated dashboards stand out:
- Live Data Feeds: Pulls real-time data from all your marketing channels (Google Ads, Facebook, LinkedIn, and more).
- Unified Metrics: Aggregates siloed data into a single, interactive dashboard.
- Always Up-to-Date: No more waiting for monthly spreadsheet updates. See today’s performance, today.
- Interactive Visualizations: Drill down into campaigns, channels, or KPIs with just a click.
Who Benefits from Automated KPI Dashboards?
- Agencies:
- Manage reporting for dozens (or hundreds) of clients.
- Handle unique KPIs for each client, across many platforms.
- Brands (Especially Multi-Location):
- Consolidate data from different regions, franchises, or product lines.
- Eliminate data silos for a unified marketing view.
- Enterprise Teams:
- Feed clean, consistent data to business intelligence (BI) tools.
- Give every stakeholder access to the same, trusted metrics.
Why Switch from Manual to Automated Reporting?
Let’s break down the major advantages:
| Traditional Reporting | Automated KPI Dashboards |
|---|---|
| Manual data gathering | Live, automatic data pulls |
| Spreadsheet errors | Trusted, consistent metrics |
| Static, outdated reports | Always up-to-date insights |
| Hours spent on prep | Instant access & delivery |
What Can You Do with an Automated Dashboard?
- Instantly monitor campaign performance and ROI
- Spot trends and respond to them as they happen
- Automate delivery of reports to teams, clients, or executives
- Scale your reporting as your business (and data) grows
Curious to learn more?
Dive deeper with this digital marketing KPI dashboard overview to see exactly how automated dashboards can supercharge your marketing workflow and drive real ROI.
Key Features of an Advanced Marketing KPI Automation Platform
To achieve true marketing insight at scale, an advanced KPI automation platform must deliver far more than simple charts and scheduled reports. Today’s leading solutions—such as TapClicks—combine powerful data integration, real-time analytics, and intelligent automation to simplify and supercharge every aspect of KPI reporting.
1. Robust Data Connectors:
A foundational feature is the ability to seamlessly connect with thousands of marketing, advertising, and business data sources. Platforms like TapClicks offer over 10,000 built-in data connectors, enabling you to unify campaign data from Google Ads, Facebook, programmatic platforms, CRMs, and more. This eliminates time-consuming, error-prone manual imports and ensures your dashboard always reflects the most up-to-date performance metrics.
2. Real-Time Updates and Automated Data Refresh:
Unlike static or manually updated reports, automated dashboards continuously pull in and refresh data in real time. This gives marketers instant visibility into campaign KPIs—no more waiting for end-of-week downloads or scrambling to update spreadsheets before client calls. Real-time updates support agile decision-making and allow teams to spot emerging trends or issues before they impact results.
3. AI Analytics Reporting:
At the heart of advanced automation platforms is AI-powered analytics. TapClicks, for example, leverages intelligent agents that scan your dashboard data, surface key insights, flag anomalies, and even suggest optimization tactics automatically. This goes beyond passive reporting—AI analytics transforms your dashboard into an active partner that helps prioritize opportunities and mitigate risks across all digital channels.
4. ROI Visualization & Multi-Channel Performance Analytics:
The best platforms allow you to visualize ROI and performance across every campaign, channel, and client in one place. Customizable widgets, drag-and-drop dashboards, and branded reporting studios make it simple to track spend, conversions, revenue, and other critical KPIs. Cross-channel analytics capabilities ensure you’re not just seeing siloed results, but gaining a holistic understanding of marketing effectiveness.
5. Automated Marketing Metrics Tracking:
Central to any automation platform is the ability to track and report on KPIs without manual intervention. Scheduled, rules-based reporting eliminates repetitive tasks and guarantees consistency—whether you’re monitoring daily pacing or quarterly goals. Automated alerts can also notify stakeholders of significant changes or achievements, keeping everyone aligned and informed.
TapClicks distinguishes itself with unified scale, deep automation, and AI-driven recommendations—making it a leader in reporting automation for agencies, brands, and enterprise teams. These features empower marketers to move beyond fragmented, labor-intensive reporting and unlock actionable insights with unprecedented speed and accuracy.
Benefits of Automated KPI Dashboards for Marketers
Adopting an automated KPI dashboard delivers transformative advantages for marketers, agencies, and enterprises alike. The most immediate benefit is the dramatic time savings: instead of spending hours each week manually gathering data from disparate platforms, marketers can automate data pulls and report generation. Platforms like TapClicks often reduce reporting workloads by 50+ hours per analyst per month, freeing teams to focus on strategy, creative, and optimization rather than data wrangling.
Error reduction is another critical advantage. Manual data entry and spreadsheet consolidation are not only tedious but also prone to mistakes that can undermine the accuracy of campaign analysis. Automated dashboards eliminate these risks by ensuring data is consistently updated and normalized across all channels. With a single source of truth, marketing teams can trust the numbers and avoid costly misinterpretations.
Enhanced visibility is a game-changer for digital campaign KPI tracking. Automated dashboards unify performance metrics from search, social, display, and other channels into a holistic, real-time view. Marketers no longer have to log into multiple platforms or wait for end-of-month reconciliations—insights are available instantly, so teams can spot trends, troubleshoot issues, and measure ROI as campaigns unfold.
Ultimately, automated KPI dashboards empower faster, more confident decision-making. With live data and AI-powered insights at their fingertips, marketers can respond to opportunities and challenges in real time. Whether it’s reallocating budget for underperforming campaigns or capitalizing on emerging trends, the ability to act quickly drives better results and a stronger competitive edge. For those ready to streamline reporting and unlock actionable marketing intelligence, solutions like TapClicks provide the foundation for next-level operational efficiency and growth.
Real-Time Performance Dashboards: How They Work
At the heart of automated KPI reporting is the real-time performance dashboard: a dynamic interface that transforms raw marketing data into actionable insights as campaigns unfold. Here’s how these dashboards deliver instant clarity and control—eliminating the lag between data collection and decision-making.
1. Seamless Data Integration
The process begins with robust data connectors that pull information from thousands of marketing, advertising, and business platforms—think Google Ads, Facebook, CRMs, and more. Solutions like TapClicks automatically extract and unify data streams, standardizing disparate metrics across channels. This automated pipeline ensures that every data point, from impression counts to conversion values, is continuously updated without manual intervention.
2. Automated Data Transformation and Enrichment
Once ingested, the data undergoes automated transformation: cleaning, normalization, and enrichment. Advanced platforms blend cross-channel data, reconcile naming conventions, and align metrics for apples-to-apples reporting. For multi-location brands or agencies managing multiple clients, this step guarantees a single source of truth—regardless of complexity.
3. Live Visualization and KPI Tracking
As soon as data is processed, it’s visualized in real time. Customizable dashboards display up-to-the-minute KPIs, campaign pacing, and performance trends. Instant filtering, drill-downs, and cross-channel comparisons empower marketers to spot anomalies, opportunities, or underperforming tactics as they happen—not days later. This immediacy is especially valuable for fast-moving campaigns or high-volume environments.
4. Automated Reporting and Alerts
With real-time dashboards, manual report building becomes a relic of the past. Marketers can schedule automated reports, set up threshold-based alerts, and share live dashboards with stakeholders—ensuring everyone stays aligned with the latest results. For agencies and enterprise teams, this means streamlined communication and less time spent on repetitive data pulls.
5. Actionable Insights at Your Fingertips
The power of real-time dashboards is amplified by AI analytics and automation. As highlighted in this deep dive into real-time analytics and dashboard automation, platforms like TapClicks use AI agents to surface insights, flag anomalies, and even recommend optimizations—directly within the dashboard.
The Bottom Line:
Real-time performance dashboards transform marketing operations from reactive to proactive. They unify the data flow from integration to visualization and reporting, empowering teams to manage campaigns with agility and precision. With tools like TapClicks, marketers can finally keep pace with digital’s speed—acting on what’s happening now, not what happened last week.
AI Analytics Reporting and Automated Insights
Traditional marketing dashboards excel at visualizing KPIs, but they still rely on users to interpret the data and uncover trends. This is where AI-driven analytics fundamentally transforms the reporting experience: by automating not just the collection and display of metrics, but also the synthesis of actionable insights. With advanced AI analytics reporting, marketers no longer need to sift through mountains of data or manually flag performance anomalies—AI does the heavy lifting, surfacing what matters most in real time.
At the heart of this transformation are automated analytics workflows. TapClicks leverages AI agents that continuously scan your dashboard data, identifying patterns, outliers, and emerging trends across all channels. For example, AI might detect an unexpected spike in click-through rates on a specific campaign, or flag a downward trend in engagement before it impacts ROI. These insights are not buried in complex tables—they’re presented as clear, prioritized recommendations. Whether it’s a suggestion to reallocate budget, optimize creative, or adjust targeting, AI-generated guidance empowers teams to act with precision and speed.
Predictive models take AI analytics reporting a step further. By analyzing historical performance and current trends, TapClicks’ AI can forecast future outcomes—such as which campaigns are likely to exceed goals, or where budget pacing may fall short. This foresight allows marketers to proactively tweak strategy, rather than reacting after the fact.
The result is a marketing insights dashboard that doesn’t just report on what happened, but actively drives optimization. Automated insight summaries, such as those delivered via TapClicks’ SmartEmail, ensure that stakeholders stay informed without manual intervention. No more endless status meetings or delayed analysis—AI-powered dashboards keep your entire team aligned and focused on the next best action.
To see how automated analytics and real-time insights can supercharge your marketing operations, explore the latest in reporting automation with TapClicks.
Cross-Channel Performance Analytics: Unifying Data Silos
Modern marketing is inherently multi-channel—spanning search, social, display, video, email, and beyond. Yet, each channel often comes with its own analytics and reporting tools, creating isolated “data silos” that make holistic performance analysis difficult, if not impossible. This fragmentation slows down teams, obscures the true ROI of campaigns, and hinders optimization efforts.
An automated KPI reporting dashboard solves this challenge by consolidating disparate datasets into a single, unified view. With advanced data connectors and automated ETL/ELT pipelines, platforms like TapClicks can ingest, normalize, and blend data from thousands of sources—Google Ads, Facebook, programmatic platforms, email CRMs, and more—without manual spreadsheet wrangling. This cross-channel performance analytics capability empowers marketers to track digital campaign KPIs across every touchpoint, visualize the entire customer journey, and attribute results accurately.
The benefits of unified metrics go far beyond convenience. Marketers gain complete visibility into how channels interact, where budgets drive the most impact, and which tactics need adjustment. For agencies managing multiple clients or brands with multi-location footprints, consolidated dashboards ensure consistent, apples-to-apples reporting and faster insights. With TapClicks, these unified dashboards are not only automated, but also customizable—allowing users to drill down, filter by segment, or benchmark performance at any level.
Ready to move past siloed reporting and unlock true cross-channel insights? Discover how performance marketing reporting automation streamlines campaign analysis and drives better decision-making in this in-depth guide. For more on how TapClicks can unify your data and reporting at scale, visit the TapClicks website.
Scaling Client KPI Reporting and Collaboration
As marketing agencies, media companies, and multi-brand organizations grow, the complexity of client reporting scales exponentially. Juggling hundreds—or even thousands—of dashboards and reports across diverse campaigns, channels, and stakeholders demands a robust, automated solution. This is where a client KPI reporting tool like TapClicks delivers transformative value.
Role-Based Access for Seamless Collaboration
Effective collaboration starts with the right access for the right people. TapClicks’ role-based permissions system empowers agencies to grant tailored access to internal teams and external clients. Executives might need a high-level overview, account managers require campaign drill-downs, and clients want branded, on-demand dashboards. With customizable roles, everyone sees exactly what they need—no more, no less—securely and efficiently.
Branded Reporting at Scale
Client experience is key, and branded reporting elevates agency professionalism. TapClicks enables agencies to create white-labeled dashboards and reports, complete with custom logos, color schemes, and even domain masking. Whether you’re serving a single enterprise client or hundreds of SMBs, each report feels personalized and on-brand—instilling trust and reinforcing your agency’s value.
Automated Report Distribution
Manual report generation and distribution are relics of the past. TapClicks automates the entire process: build reusable templates, schedule delivery (daily, weekly, monthly), and send reports directly to clients’ inboxes. Advanced features like SmartEmail even allow for automated, AI-curated insights to be included, ensuring stakeholders receive not just data—but actionable summaries—without any manual intervention.
Supporting High-Volume Client Reporting
What truly sets TapClicks apart is its ability to scale. The platform is engineered to handle thousands of dashboards, reports, and users simultaneously—ideal for agencies and media organizations managing extensive client portfolios. Automation reduces reporting workloads by up to 50+ hours per analyst each month, freeing teams to focus on strategy rather than spreadsheets.
For agencies and organizations seeking to streamline client KPI reporting, foster seamless collaboration, and deliver insights at scale, TapClicks provides the unified platform to make it happen. As your client roster grows, TapClicks ensures your reporting and collaboration capabilities grow with you—efficiently, securely, and with an elevated client experience.
Getting Started with Automated KPI Reporting Dashboards
Ready to transform your marketing operations with automated KPI reporting dashboards? Here’s a practical guide to evaluate, implement, and maximize the value of a data-driven dashboard solution for your organization.
1. Assess Your Current Reporting Needs and Challenges
Begin by mapping out your essential marketing KPIs, the channels you operate on, and your existing sources of data. Identify pain points—such as manual data pulls, reporting errors, or siloed analytics—that slow down your current workflow.
2. Evaluate Platform Capabilities and Integrations
Look for a dashboard solution that offers robust data integration with all your marketing, advertising, and analytics platforms. Prioritize systems that provide automated ETL/ELT pipelines, flexible connectors, and the ability to blend cross-channel or multi-location data for a unified view.
3. Customize Dashboards for Your Business and Stakeholders
Choose a platform that allows easy customization—drag-and-drop dashboards, branded reporting, and role-based access controls ensure that both internal teams and clients see the most relevant metrics. Tailor your dashboards to highlight the KPIs that matter most for different users, whether that’s campaign performance, budget pacing, or ROI visualization.
4. Automate Reporting and Insights Delivery
Set up scheduled, automated reporting to eliminate repetitive manual tasks and guarantee timely delivery of insights. Solutions like TapClicks provide “SmartEmail” and AI-powered summaries, ensuring key stakeholders receive actionable analytics directly in their inboxes.
5. Integrate with Your Business Intelligence Stack
For larger organizations or those with existing BI infrastructure, select a platform that can serve as both a standalone dashboard and a data hub. TapClicks, for example, can pipe cleaned and enriched data directly into BI tools like Tableau, Power BI, or Looker, supporting deeper analysis and company-wide alignment.
6. Monitor, Optimize, and Scale
Once live, monitor dashboard adoption and data accuracy. Leverage AI analytics, predictive models, and automated alerts to continuously uncover new optimization opportunities. As your needs grow, ensure your dashboard can scale—handling more clients, locations, or data sources without performance loss.
Unlock Your Marketing Potential
Adopting an automated KPI reporting dashboard is a strategic investment in efficiency, accuracy, and insight-driven marketing. To see how TapClicks can serve as the foundation for your marketing metrics automation, real-time analytics, and ROI visualization, visit TapClicks and explore the platform’s unified approach to modern marketing operations.
Start Automating Your Marketing Data Today!
No Credit Card Required.

