

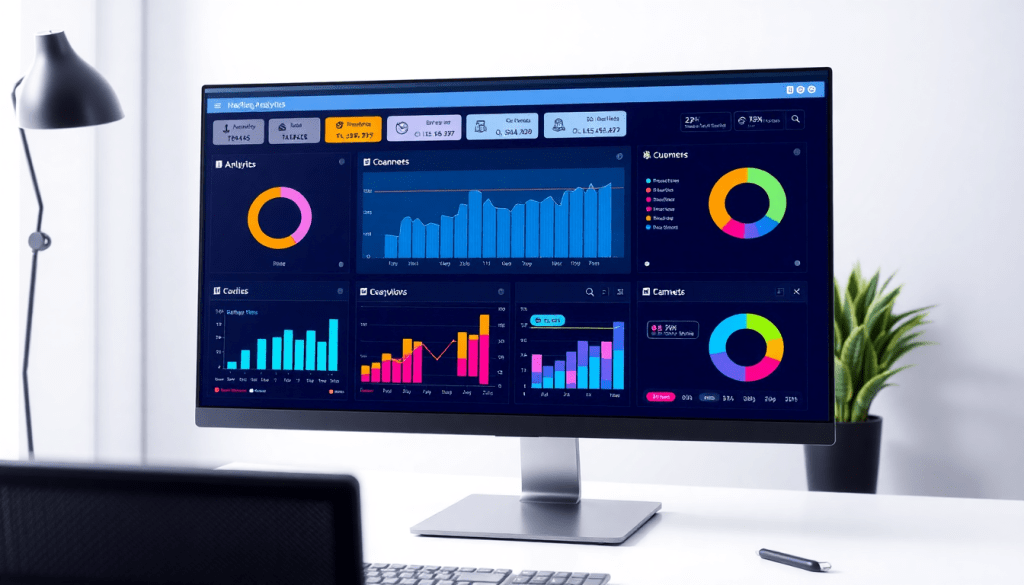
Automated KPI Reporting Dashboard: Real-Time Marketing Insights
An automated KPI reporting dashboard brings clarity and control to marketing operations. Instead of spending hours on manual data pulls and spreadsheets, marketing teams can access real-time metrics, AI-driven analytics, and cross-channel performance insights—all within a unified dashboard. With solutions like TapClicks, KPI automation not only saves time but also delivers more actionable insights, empowering teams to make faster, smarter decisions. Whether you manage campaigns for clients or run data-driven programs in-house, automated dashboards streamline reporting, enhance collaboration, and elevate your marketing impact.
Why Automated KPI Reporting Matters for Modern Marketing
Manual marketing reporting has long been a source of frustration for teams striving to keep pace with modern demands. The process is notoriously time-consuming: marketers must log into multiple platforms, export spreadsheets, reconcile data by hand, and compile performance summaries—often repeating this tedious cycle weekly or even daily. Such manual workflows not only drain valuable time but also introduce a significant risk of human error, from misaligned dates to formula mistakes, that can distort campaign insights and erode stakeholder trust. Most critically, by the time reports are finalized, the data is already outdated, limiting teams’ ability to respond to opportunities or issues in real time.
Automated KPI reporting transforms this landscape by streamlining data collection, normalization, and visualization into a centralized, always-up-to-date dashboard. With automation, marketing teams gain instant access to campaign metrics across channels—social, search, display, and more—eliminating lag time and enabling data-driven decisions on the fly. Automation also enhances accuracy by removing manual touchpoints and ensures every stakeholder sees a consistent, reliable view of performance.
Platforms like TapClicks are purpose-built for this new era of marketing operations. TapClicks unifies thousands of data sources, provides drag-and-drop dashboards, and leverages AI-powered analytics to surface insights without the need for spreadsheet gymnastics. Whether managing hundreds of client campaigns or optimizing in-house programs, TapClicks’ scalable, automated dashboards deliver the clarity, speed, and confidence that modern marketing requires.
To see how automated dashboards can accelerate your KPI workflows and ROI visibility, explore the article “Digital Marketing KPI Dashboard: Visualize Metrics & ROI Fast.” This resource highlights the tangible benefits of moving from manual reporting to an automated, insight-driven approach.
Key Features of Automated KPI Reporting Dashboards
Automated KPI reporting dashboards are designed to transform how marketing teams manage, analyze, and present data. Their core features provide the foundation for scalable, insight-driven operations—eliminating manual processes and surfacing the performance metrics that matter most.
Real-Time Data Integration
The backbone of any effective KPI dashboard is seamless data integration. Modern platforms like TapClicks offer connections to thousands of marketing, advertising, and business data sources. This enables marketers to centralize disparate datasets—from paid search and social to CRM and web analytics—into a single, always-updated view. With real-time pipelines, teams can monitor campaigns as they unfold, spot anomalies instantly, and react faster to changing trends.
Cross-Channel Metrics and Custom Reporting
Automated dashboards blend multi-channel data to deliver a holistic understanding of marketing performance. Users can track KPIs across platforms—Google Ads, Facebook, email, programmatic, and more—within a unified interface. Custom reporting tools allow marketers to tailor dashboards to specific clients, campaigns, or business units. Drag-and-drop editors and widget libraries make it easy to visualize metrics that align with each stakeholder’s priorities.
AI Insights and Smart Analytics
Beyond reporting, automated dashboards increasingly leverage AI to interpret data and surface actionable recommendations. Features like TapClicks’ SmartPilot analyze campaign performance, benchmark results, and provide optimization suggestions—transforming raw numbers into strategic guidance. AI-powered anomaly detection, automated trend analysis, and predictive models help marketers proactively manage budgets and maximize ROI.
Automated Scheduling, White-Labeling, and Access Controls
Efficiency gains come from more than just automation of data pulls. Top platforms allow users to schedule recurring reports, automate email delivery, and set up always-on dashboards for clients or internal teams. White-labeling ensures reports and portals match agency or brand identity. Meanwhile, granular access controls let organizations manage who sees what—essential for agencies juggling hundreds of client accounts or multi-location brands with distributed teams.
ROI Visualization and Digital Campaign Tracking
A key value of automated KPI dashboards lies in their ability to make ROI crystal clear. Interactive visualizations highlight spend, conversions, and revenue across every channel and tactic. Marketers can track digital campaign KPIs—like cost per acquisition, ROAS, and customer lifetime value—without manual calculation or spreadsheet wrangling.
TapClicks’ Unique Strengths: Scalability and Workflow Automation
What sets TapClicks apart is its capacity to handle reporting at scale—supporting thousands of dashboards and users simultaneously. Its integrated order management and workflow tools streamline campaign setup, approvals, and collaboration, bringing operations and analytics together in a single platform. For a deeper dive into how these features accelerate marketing ROI and transparency, explore "Digital Marketing KPI Dashboard: Visualize Metrics & ROI Fast".
By unifying these capabilities, automated KPI reporting dashboards empower marketers to focus less on manual data wrangling—and more on driving results.
Building a Real-Time Marketing Performance Dashboard
Creating an effective real-time dashboard is more than just plugging in numbers—it’s about connecting your entire marketing ecosystem, surfacing insights, and empowering teams to act quickly. Let’s walk through the process, step by step.
Step 1: Connect All Your Marketing Data
Start by bringing all your key data sources into one place. With TapClicks, this is fast and seamless thanks to:
- 10,000+ pre-built connectors: Instantly pull data from Google Ads, Facebook Ads, Google Analytics, CRMs, email platforms, and more.
- Automated ETL/ELT pipelines: No manual downloads or spreadsheet wrangling—your data is always up to date and normalized.
- Unified environment: See campaign, audience, and sales data side by side for a holistic view.
Step 2: Choose KPIs That Matter
Not all metrics are created equal. For a dashboard that drives action:
- Focus on business impact: Track cost per acquisition, ROAS, conversion rates, or multi-channel attribution.
- Collaborate with stakeholders: Ensure KPIs reflect what matters to execs, clients, and sales teams.
- Review and adjust: As strategies shift, revisit your KPIs to keep them relevant.
Step 3: Design for Your Audience
A dashboard is only as helpful as it is usable. Personalize your layout by:
- Using drag-and-drop widgets: Quickly organize metrics by channel, goal, or region.
- Applying branded templates: Customize for different clients, business units, or executives.
- Segmenting dashboards: Build views tailored for sales, operations, or analytics teams—all within TapClicks.
Step 4: Automate Reporting and Collaboration
Let automation do the heavy lifting so your team can focus on strategy:
- Schedule data refreshes: Keep metrics real-time without manual updates.
- Automate report distribution: Set up recurring emails to internal teams or clients.
- Role-based access: Ensure everyone sees the right data and can collaborate seamlessly.
Step 5: Optimize and Evolve
A great dashboard is never “done.” Keep improving by:
- Leveraging AI insights: TapClicks’ built-in AI surfaces trends, anomalies, and recommendations automatically.
- Iterating your design: Regularly tweak layouts and KPIs based on feedback and performance.
- Tracking impact: Use analytics to see which dashboard views drive the most engagement and action.
Want to Dive Deeper?
- 📊 See best practices for dashboard automation
- 🚀 Discover how TapClicks unifies and automates reporting
With the right setup, your real-time dashboard becomes the single source of truth for your entire marketing operation—empowering smarter, faster decisions at every level.
AI Analytics Reporting: Turning Data Into Actionable Insights
Modern marketers face a mountain of data, but the real challenge is turning that data into meaningful action. This is where AI-powered analytics, like those found in TapClicks’ SmartPilot, become a game-changer. Unlike traditional dashboards that simply display metrics, AI-driven platforms actively analyze datasets to surface trends, flag anomalies, and deliver proactive recommendations. For example, SmartPilot can identify underperforming campaigns, suggest budget reallocations, and highlight emerging opportunities—all without manual intervention.
Predictive analytics is another powerful advantage. TapClicks’ AI models can forecast campaign performance, benchmark results against industry standards, and provide pacing insights to ensure budgets are optimized throughout the month. This allows marketers to adjust strategies in real time, preventing wasted spend and maximizing ROI.
Automated marketing metrics go beyond historical reporting. With AI agents embedded in the dashboard, teams receive ongoing optimization suggestions based on live data. Features like SmartEmail take it a step further by automatically generating and sending insight-rich summaries to stakeholders, ensuring everyone stays informed and ready to act. These capabilities empower marketing teams to be not just reactive, but truly proactive—transforming vast quantities of campaign data into clear, actionable next steps for better performance and stronger outcomes.
To see how AI-powered dashboards can revolutionize your approach, visit TapClicks or explore real-world use cases in "Marketing Dashboard Automation: Boost Analytics & Reporting".
Cross-Channel Performance Analytics and Visualization
In today’s fragmented marketing landscape, unified cross-channel reporting isn’t just a nice-to-have—it’s essential for agencies and brands aiming to maximize campaign performance and prove ROI. Automated KPI reporting dashboards bring together data from disparate sources—social media, search engines, display networks, email platforms, and even offline channels—into a single, cohesive view. This consolidation empowers marketers to spot trends, compare channel effectiveness, and make real-time optimizations, all without the tedious data wrangling of manual processes.
Platforms like TapClicks excel at blending data across channels and campaigns, regardless of scale or complexity. With seamless integrations to over 10,000 marketing and business data sources, TapClicks dashboards allow users to visualize metrics from Google Ads, Facebook, programmatic display, and more alongside CRM and even offline conversion data. This holistic approach means marketers can attribute results accurately, monitor spend and performance by channel, and tailor strategies for each audience segment.
Visualization tools within these dashboards are designed for clarity and action. Marketers can configure multi-location and multi-client views, enabling both granular and high-level performance monitoring. Customizable widgets, trend graphs, and automated heatmaps make it easy to identify which channels are driving the most value, where budget shifts may be required, and how performance stacks up across locations or clients. For agencies managing distributed teams or brands with dozens of locations, this level of visibility is a game-changer.
For a deeper dive into how automated platforms streamline performance analytics and insights, check out "Performance Marketing Reporting Software: Automate Campaign Insights". By leveraging cross-channel analytics and powerful visualization tools, marketers can finally move from reactive reporting to proactive, data-driven decision-making—elevating both campaign outcomes and client satisfaction.
Client KPI Reporting Tools: Streamlining Communication and Transparency
Clear, timely communication is the foundation of strong client relationships for agencies and marketing service providers. Automated KPI reporting dashboards transform how agencies share performance data, replacing static spreadsheets and manual updates with dynamic, always-available insights. By offering clients real-time access to their key performance indicators (KPIs), agencies foster greater transparency, build trust, and set themselves apart in a crowded marketplace.
One of the most powerful aspects of platforms like TapClicks is the ability to tailor client experiences through role-based access controls and white-label branding. Agencies can grant each client access to a dedicated dashboard, customized with their own logos and color schemes, and ensure stakeholders only see the data relevant to their campaigns. This level of personalization not only reinforces agency value but also makes complex marketing data much more approachable for clients.
Automated scheduling features further streamline communication by generating and delivering branded reports at regular intervals—weekly, monthly, or even on-demand. This eliminates the bottleneck of manual report creation and ensures clients are always kept up to date on campaign performance, budget pacing, and ROI. Instead of chasing data, account managers can focus on strategic conversations and proactive service.
For agencies managing dozens or even hundreds of clients, scalability is essential. TapClicks’ unified dashboard architecture enables seamless management of multiple accounts, with robust collaboration tools for sales, operations, and fulfillment teams. Agencies can easily toggle between client views, share insights, and address questions in real time—without ever leaving the platform. As highlighted in "Performance Marketing Reporting Software: Automate Campaign Insights", this approach not only boosts efficiency but also enhances client satisfaction, retention, and growth.
In summary, automated client KPI reporting tools drive transparency, accountability, and efficiency—helping agencies strengthen client relationships and scale their impact with confidence.
Turning Marketing Results Into ROI Stories Stakeholders Understand
Automated KPI reporting dashboards don’t just save time—they turn marketing performance into clear, compelling stories that resonate with stakeholders. Instead of sifting through scattered spreadsheets, your team can use ROI visualization tools to:
- Show campaign performance, spend, and revenue—side by side
- Track results across all channels (digital, traditional, offline)
- Bring KPIs to life with charts, trends, and custom executive summaries
Platforms like TapClicks tie all this together, giving you a single, intuitive view of what’s working and why.
What Should You Track? The Metrics That Matter
| Metric | What It Tells You | Why It Matters |
|---|---|---|
| Cost-per-acquisition (CPA) | The cost to acquire a customer | Evaluates efficiency of spend |
| Return on ad spend (ROAS) | Revenue generated per $1 ad spend | Measures true campaign profitability |
| Lifetime value (LTV) | Total revenue from a customer | Helps justify long-term marketing investment |
| Conversion rate | % of users who complete a key action | Indicates campaign or channel effectiveness |
With TapClicks, these metrics are automatically aggregated in real time, so you can:
- Spot high-level trends or drill down for granular insights
- Generate on-demand executive summaries
- Run period-over-period comparisons for clients or management
How to Make ROI Insights Drive Real Business Impact
To get the most from automated dashboards, connect your marketing results directly to business goals. For example:
- Link campaign performance to sales pipeline growth
- Map retention or churn improvements to customer value
- Track regional campaigns against expansion targets
This approach transforms marketing from a “cost center” to a proven growth engine—and gives leadership the confidence to double down on what works.
In a Nutshell
With TapClicks’ unified dashboards and automated reporting, marketers can:
- Prove campaign impact with clear, data-driven visuals
- Tailor reports for every audience, from execs to account managers
- Drive more strategic conversations with leadership and clients
When you can link every dollar spent to real business results—with clarity and confidence—marketing becomes a true driver of growth.
How to Find the Perfect Data-Driven Marketing Dashboard
Choosing a marketing dashboard platform isn’t just about pretty charts—it’s about making your entire operation smarter, faster, and more efficient. Whether you’re an agency juggling hundreds of clients or a brand looking for a single source of truth, the right dashboard can transform your marketing from reactive to strategic. Here’s what to look for as you compare your options:
Key Features That Make a Real Difference
🔗 Connect Everything (Deep Integrations)
- Seamless connections to all your marketing and sales channels—digital, offline, CRM, and more
- Thousands of prebuilt data connectors (not just a handful)
- Custom integration options for those unique data sources
- Unified campaign, budget, and performance tracking—no more manual exports
🚀 Grow Without Limits (Scalability & Performance)
- Handles thousands of dashboards and automated reports—no slowdowns
- Designed for high-volume teams (think agencies, multi-location brands)
- Effortlessly supports growing client portfolios and complex campaign structures
🤖 Get More Than Just Data (AI & Insights)
- Built-in AI agents to spot anomalies and trends before you do
- Predictive models for budget pacing and campaign optimization
- Automated insight summaries (like TapClicks’ SmartEmail) straight to your inbox or client’s inbox
- Recommendations you can act on, not just charts to stare at
🤝 Workflows That Actually Work (Automation & Collaboration)
- Order management, client approvals, and role-based access—built right in
- Automated scheduling, white-labeling, and report delivery
- Tools to keep everyone (sales, ops, fulfillment) on the same page
🛠️ Tailored for You (Support & Customization)
- Responsive onboarding and customer support
- Highly customizable dashboards, metrics, and permissions
- Built to fit your specific reporting needs, not just generic templates
How TapClicks Measures Up
Let’s see how TapClicks compares to other popular platforms:
| Feature / Platform | TapClicks | Funnel.io | Adverity | Supermetrics | Agency Analytics |
|---|---|---|---|---|---|
| Deep Integrations | 10,000+ connectors | Good | Good | Good | Limited |
| Scalable Performance | Enterprise-grade | Varies | Varies | Varies | Limited |
| AI Insights | Advanced (SmartPilot, SmartEmail) | Basic | Basic | Basic | Minimal |
| Workflow Automation | Built-in (orders, approvals, collaboration) | None/Basic | None/Basic | None | Minimal |
| Customization & Support | High | Moderate | Moderate | Moderate | Basic |
Making Your Evaluation Process Smoother
Here’s a quick checklist to keep you focused:
- Does it connect to all my data sources, now and in the future?
- Is it built to handle my volume of dashboards, clients, and reports?
- Are AI-driven insights and recommendations included, or just visualizations?
- Can I automate reporting, approvals, and distribution?
- Is it customizable to my workflows and client needs?
Pro Tip:
Always request a live demo using your own data, and test key workflows before making a commitment.
By focusing on these priorities, you’ll land a dashboard platform that not only centralizes your data but also propels your marketing team to new heights of efficiency and insight. TapClicks is purpose-built for this kind of growth—combining deep integration, automation, and real AI insights in a single platform.
Start Automating Your Marketing Data Today!
No Credit Card Required.

