

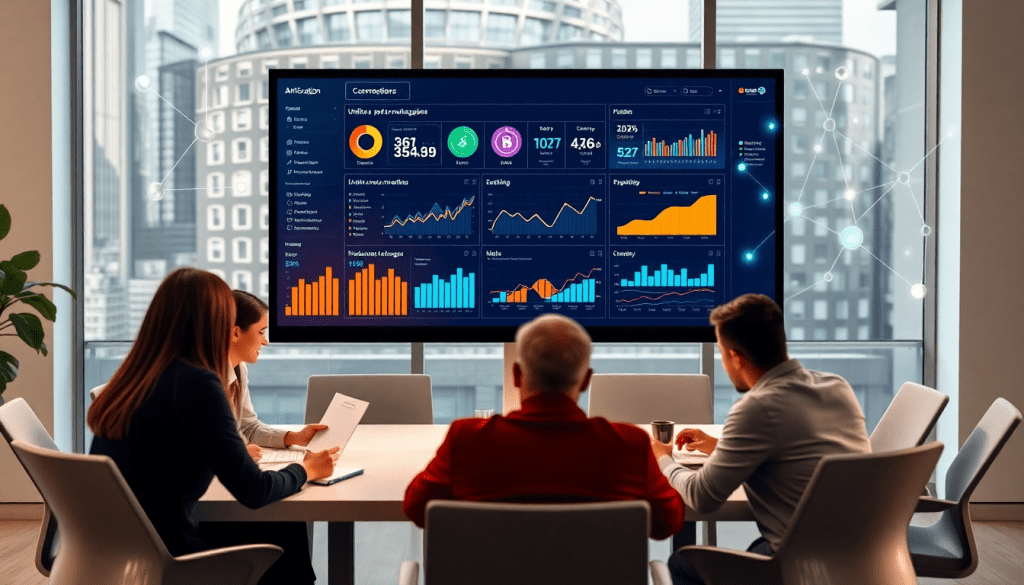
AI Data Visualization Tool for Marketing Teams: TapClicks
For marketing teams managing complex, multi-channel campaigns, the ability to turn raw performance data into clear, actionable insights can make the difference between wasted spend and breakthrough results. TapClicks delivers an AI data visualization tool for marketing teams that unifies your analytics, automates reporting, and transforms metrics into compelling stories—all within a single platform. Discover how TapClicks’ AI-powered dashboards and automated marketing analytics enable marketers to visualize data, uncover trends, and optimize campaigns with confidence.
The Need for AI Data Visualization in Modern Marketing
Today’s marketing landscape is more fragmented than ever. Marketers routinely manage campaigns that span paid search, social media, programmatic display, email, and beyond—each channel generating a deluge of data in its own unique format. The resulting data silos make it nearly impossible to get a unified view of performance, let alone extract actionable insights quickly. Without a way to visualize and compare metrics across platforms, marketing teams risk missing out on optimization opportunities, duplicating efforts, or misallocating budget.
This is where AI-powered data visualization becomes indispensable. Traditional dashboards can display key performance indicators, but they often require manual data wrangling and constant upkeep to stay relevant. In contrast, AI-enhanced visualization tools do more than aggregate charts—they automatically analyze incoming data streams in real time, flag anomalies, and surface trends or opportunities marketers might otherwise overlook. With AI-generated insights woven directly into dashboards, teams are no longer bogged down by manual reporting or endless spreadsheet pivots. Instead, they can focus on strategic decision-making based on automatically surfaced recommendations and predictive models.
The pain points are clear: marketers struggle with disconnected data sources, time-consuming manual reporting, and the overwhelming challenge of extracting meaningful insights from raw metrics. AI data visualization tools like TapClicks address these issues by unifying campaign data, automating analysis, and transforming raw numbers into clear, actionable stories that drive smarter marketing outcomes.
TapClicks: All-in-One AI Data Visualization Platform
TapClicks stands out as a comprehensive marketing intelligence platform that reshapes how marketing teams analyze, report, and act on their data. Unlike fragmented toolsets that require marketers to juggle multiple dashboards and manual exports, TapClicks brings everything into a single, unified hub—combining data integration, AI-powered analytics, automated reporting, and workflow management.
At its core, TapClicks leverages advanced automation to streamline the entire marketing analytics process. With over 10,000 pre-built connectors, teams can effortlessly unify data from disparate sources—whether it’s paid search, social, display, or offline channels—eliminating silos and reducing hours of manual data wrangling. The platform’s AI capabilities go beyond visualization; they actively analyze campaign performance, surface actionable insights, and deliver smart recommendations for optimization.
What sets TapClicks apart is its focus on scalability and flexibility. Whether you’re an agency reporting to hundreds of clients or a multi-location brand consolidating analytics across regions, TapClicks handles high-volume data and reporting at enterprise scale. Automated report scheduling, drag-and-drop dashboards, and customizable client access empower teams to deliver compelling, consistent insights—no matter the complexity or size of their marketing operations.
To see how TapClicks’ unique approach to AI analytics transforms marketing data into business intelligence, explore this in-depth platform overview: AI Data Visualization Tool for Marketing Teams: TapClicks.
See How TapClicks’ AI-Powered Dashboards Take the Pain Out of Marketing Data
Juggling dozens of platforms, campaigns, or clients? TapClicks’ AI-powered dashboards are built to make your life easier—and your marketing smarter.
Effortless Data Integration: All Your Channels, One Place
How it works:
- Connect to 10,000+ sources: Instantly pull data from social, search, display, email, and more with pre-built connectors and Smart Connectors.
- No more manual imports: Automated data flows eliminate patchwork spreadsheets and tedious exports.
- Unified platform: Every campaign, every metric, every client—centralized.
Real-Time AI Analytics: Transform Data Into Insights
Once your data arrives, TapClicks puts its AI to work:
- Automated ETL/ELT: Raw data is extracted, transformed, and loaded—no technical setup required.
- Cross-channel normalization: Compare apples-to-apples across every campaign, channel, and client.
- Drag-and-drop dashboard builder: Visualize KPIs that matter most—impressions, conversions, ROI, or multi-location stats—with just a few clicks.
From Dashboards to Dynamic, Automated Reporting
TapClicks doesn’t just visualize your data—it makes it actionable:
- Branded, scheduled reports: Auto-generate and send customized reports to clients or internal teams.
- Zero last-minute scrambling: Always have the latest insights ready for every meeting.
- Interactive, filterable dashboards: Go from “what happened?” to “what’s next?” in seconds.
AI-Powered Insights Delivered Right to You
Let TapClicks’ intelligence do the heavy lifting:
- SmartEmail: Get digestible, AI-curated campaign insights sent directly to your inbox.
- TapInsights: Automatically highlights trends, anomalies, and optimization opportunities—no manual digging required.
- Real-time alerts: Spot what’s working, uncover growth opportunities, and act immediately.
Why Marketers Love TapClicks Dashboards
| Old Way | With TapClicks |
|---|---|
| Manual data pulls | Automated, real-time data integration |
| Static, siloed spreadsheets | Unified, interactive dashboards |
| Reactive, delayed reporting | Proactive, AI-powered insights |
| Hours spent on report formatting | Branded, scheduled, auto-delivered reports |
Unlock a 360° View—And Tell Smarter Stories
With TapClicks, your marketing data becomes clear, actionable, and always up to date. Spend less time wrangling spreadsheets and more time optimizing campaigns, justifying spend, and impressing clients.
Ready to see how it all works? Check out our AI Data Visualization Tool for Marketing Teams: TapClicks overview.
Transforming Raw Data Into Marketing Data Storytelling
Marketing data storytelling is the art of weaving complex analytics and metrics into clear, compelling narratives that inform, persuade, and spark action. For agencies and brand teams alike, it’s not enough to have access to charts and figures—what drives results is the ability to translate those raw numbers into insights that influence decisions and strategies.
TapClicks’ AI visualization tools are engineered to bridge this gap. Instead of overwhelming marketers with dense spreadsheets or static dashboards, TapClicks transforms fragmented data streams into cohesive, interactive stories. By leveraging AI, the platform automatically highlights key patterns, campaign milestones, and actionable insights—allowing users to quickly understand not just what happened, but why it matters.
Consider a scenario where a multi-location retail brand runs simultaneous campaigns across search, social, display, and local media. Traditionally, pulling performance data from every channel and making sense of it requires hours of manual effort, with insights only surfacing after the fact. With TapClicks, these disparate data points are unified and visualized in real time. AI-driven dashboards surface emerging trends, such as a sudden spike in engagement from a specific channel or underperforming locations that need attention. Automated narratives and context-rich annotations guide teams toward the next steps—whether that’s reallocating budget, adjusting creative, or celebrating a successful tactic.
For agencies managing dozens or even hundreds of client accounts, marketing data storytelling is a client communication superpower. TapClicks enables agencies to deliver automated, branded reports that don’t just show results, but tell the story behind the numbers—highlighting wins, justifying recommendations, and building trust through transparency.
Ultimately, TapClicks turns raw marketing data into stories that accelerate understanding and drive smarter decisions. To see how TapClicks can transform your own reporting into actionable narratives, explore the TapClicks platform.
TapClicks Features That Turn Marketing Data Into Action
TapClicks isn’t just another reporting tool—it’s a platform built to simplify complex marketing data, deliver instant insights, and empower teams to act quickly. Here’s how TapClicks makes it happen:
Unified, Real-Time Dashboards
No more exporting spreadsheets or toggling between platforms. TapClicks brings together data from over 10,000 sources—including ad platforms, CRMs, social channels, and offline touchpoints—into a single, always-updated interface.
What you get:
- Live dashboards: Up-to-the-minute metrics and trends, refreshed automatically.
- Holistic campaign views: See paid, organic, and offline data side by side.
- Custom filters: Drill down by channel, client, or location—no coding required.
Automated AI Insight Generation
Let TapClicks do the heavy lifting. Its built-in AI agents work 24/7 to analyze your data, so you don’t have to.
How it helps:
- Actionable insights: Get plain-language explanations of anomalies (spikes, dips, pacing issues) right in your dashboard.
- Optimization tips: Receive AI-driven recommendations for budget shifts or creative tweaks.
- SmartEmail: Automated summaries and alerts sent directly to your inbox or clients, keeping everyone in the loop.
Interactive, Custom-Branded Reporting
Move from static charts to truly engaging reports with TapClicks’ drag-and-drop studio.
Key capabilities:
- Custom branding: Tailor report design for internal teams or clients.
- Interactive elements: Embed dynamic widgets and allow users to explore data (not just read it).
- Scheduled automation: Set up recurring reports—TapClicks handles delivery.
Cross-Channel Performance Visualization
Stop working in silos. TapClicks lets you compare and benchmark every channel in one place.
| Channel Type | Examples | Unified in TapClicks? |
|---|---|---|
| Paid Media | Google Ads, Meta, LinkedIn | ✔️ |
| Organic | SEO, Social, Content | ✔️ |
| Offline | Broadcast, Print | ✔️ |
Why It Matters
- Less time sifting, more time acting: TapClicks surfaces what matters, so you can make decisions, not just reports.
- Empower every team member: Even non-analysts can spot trends or dig into campaign details.
- Always-on intelligence: With AI agents and automated updates, you’re never behind on insights.
Ready for a closer look? Dive deeper into TapClicks’ AI-powered visualization suite here: TapClicks AI Visualization
Benefits for Marketing Teams and Agencies
TapClicks delivers transformative value for both in-house marketing teams and agencies by streamlining operations and unlocking deeper insights—all while drastically reducing manual effort. The platform’s automation capabilities can save analysts and account managers over 50 hours per month, freeing teams from the time-consuming tasks of manual data pulls, spreadsheet wrangling, and repetitive report generation. This translates directly into more time for strategy, optimization, and client engagement.
For agencies managing dozens or even hundreds of client accounts, TapClicks’ scalable infrastructure and role-based access controls are game changers. Teams can create and manage thousands of dashboards, each tailored to individual clients or campaigns, while maintaining a centralized source of truth for all marketing data. The platform’s collaboration tools enable sales, operations, and fulfillment teams to work seamlessly together, reducing bottlenecks and ensuring everyone has access to the latest insights.
TapClicks also accelerates speed to insight with automated, AI-driven analytics. Marketers no longer have to sift through fragmented data or wait days for reports—insights into campaign pacing, budget allocation, and performance optimization are surfaced in real time through smart dashboards and automated email summaries. This empowers teams to make smarter, faster decisions, respond proactively to trends, and demonstrate value to stakeholders with confidence.
Ultimately, TapClicks enhances marketing intelligence at every level. Whether you’re an agency juggling multi-channel campaigns or a brand seeking unified analytics across locations, TapClicks provides the tools to visualize, analyze, and act on your data—helping you deliver better outcomes for your clients and your business. To learn more about how TapClicks can transform your marketing operations, visit TapClicks.
TapClicks in Action: Real-World Use Cases
TapClicks isn’t just a powerful platform in theory—its impact is proven every day by marketing teams and agencies managing thousands of campaigns, clients, and data sources. Here’s how organizations leverage TapClicks’ AI-powered dashboards and digital performance reporting to drive measurable results:
1. Multi-Location Brands Unifying Data for Strategic Growth:
A national retail chain needed a single source of truth to track marketing performance across hundreds of locations and multiple channels. By connecting all their ad platforms, CRM, and e-commerce data to TapClicks, the brand’s marketing team built custom dashboards that visualize spend, conversions, and ROI in real time—by region, store, or channel. Automated AI insights quickly pinpointed underperforming campaigns, enabling the team to shift budgets and optimize creative on the fly. The result: faster decision-making and a double-digit lift in local campaign effectiveness.
2. Agencies Streamlining Client Reporting and Proving Value:
For agencies managing dozens or even hundreds of clients, manual reporting can eat up valuable hours every week. One media agency replaced its patchwork of spreadsheets and presentation tools with TapClicks’ automated reporting suite. Now, white-labeled dashboards and scheduled reports are delivered to clients on a set cadence, with AI-generated summaries highlighting wins and opportunities for improvement. This not only saved the agency over 50 hours per analyst per month but also strengthened client relationships through transparency and proactive insights.
3. Cross-Channel Campaign Optimization at Scale:
A B2B SaaS provider ran campaigns across search, social, programmatic, and email but struggled to compare performance and allocate budget efficiently. With TapClicks, their marketing ops team consolidated data streams into an interactive dashboard, using AI-driven visualizations to spot trends and surface actionable recommendations. The platform’s predictive models helped them benchmark results and identify the optimal media mix, leading to a significant increase in qualified leads and improved ROI.
These examples are just the beginning. TapClicks empowers teams to move from data wrangling to data storytelling, turning complex metrics into compelling narratives that drive action and showcase results. For more real-world success stories, see TapClicks Success Stories.
To explore how TapClicks can transform your own marketing operations, visit TapClicks.
Getting Started with TapClicks AI Visualization
Launching AI-driven analytics with TapClicks is straightforward, no matter your team’s size or technical skillset. Here’s how you can turn disconnected marketing data into actionable insights—fast.
Step 1: Connect All Your Marketing Data
- Link your sources:
- Paid search (Google Ads, Bing, etc.)
- Social media (Meta, LinkedIn, X, TikTok)
- Programmatic and direct buys
- CRM, offline, and custom datasets
- 10,000+ Connectors: Unify every channel with prebuilt integrations.
- Smart Connectors: Easily pull in data from niche platforms or custom spreadsheets—no IT ticket required.
Step 2: Build and Customize AI-Driven Dashboards
- Drag-and-drop interface: No code, no hassle.
- AI-powered widgets: Instantly surface insights like:
- Cross-channel performance
- Budget pacing and spend efficiency
- Real-time trend highlights
- Flexible views: Create dashboards for internal teams, execs, or client presentations.
- Branded studio: Generate polished, on-demand reports with your agency or brand look.
Step 3: Automate Reporting and Insight Delivery
- Scheduled reports: Set up recurring delivery to ensure stakeholders are always in the loop.
- SmartEmail: Automatically send AI-curated summaries and recommendations to clients or executives.
- No more last-minute scrambles: Let TapClicks handle the routine updates, so you can focus on strategy.
Tips for Supercharging Your AI Analytics
- Set clear goals: Decide which KPIs and marketing questions matter most—TapClicks’ AI will spotlight what’s important.
- Leverage built-in insights: Activate TapInsights and SmartPilot to uncover optimization opportunities and predictive trends that manual analysis might miss.
- Iterate with feedback: Refine dashboards and reports as campaigns evolve or stakeholders request new views.
- Promote collaboration: Assign role-based access so teams can:
- Share dashboards securely
- Comment and collaborate on insights
- Align on campaign adjustments without leaving the platform
Experience Effortless, Unified Marketing Analytics
Curious how AI-driven reporting can transform your team’s workflow and results?
Request a free demo or consultation with TapClicks and see how easy it is to unify your data, visualize performance, and make smarter marketing decisions—at scale.
Conclusion
In today’s fast-paced, data-driven marketing landscape, the ability to quickly convert complex metrics into actionable insights is a true differentiator. TapClicks stands out as a comprehensive marketing intelligence platform, empowering teams with AI-powered data visualization, automated reporting, and real-time marketing metrics—all in one unified solution. By eliminating manual reporting burdens and surfacing the insights that matter most, TapClicks enables marketers and agencies to save time, collaborate more effectively, and make smarter, data-backed decisions.
Whether you’re managing dozens of client accounts, optimizing multi-channel campaigns, or striving to communicate results with clarity and impact, TapClicks transforms your raw data into compelling marketing stories. Ready to experience the difference? Discover how your team can unlock the full power of AI-driven visualization and reporting by exploring TapClicks today.
Start Automating Your Marketing Data Today!
No Credit Card Required.

