

AI Data Visualization Tool for Marketing Teams: TapClicks
TapClicks is reshaping how marketing teams harness their data, transforming raw information into clear, actionable insights with advanced AI-powered dashboards and automated analytics. As marketing campaigns become more complex and channels multiply, teams need tools that not only centralize data, but also help tell the story behind the numbers. TapClicks stands out as an AI data visualization tool for marketing teams by offering real-time metrics, cross-channel views, and automated insight generation—all within an intuitive, interactive platform. This guide explores how TapClicks empowers marketers to understand performance at a glance, optimize campaigns, and communicate results with confidence.
Why Marketing Teams Need AI Data Visualization
The modern marketing landscape is a maze of data streams, platforms, and performance metrics. With campaigns spanning social media, search, email, display, and more, marketing teams are inundated with information from dozens—sometimes hundreds—of disparate channels. This explosion of data complexity makes it increasingly difficult to piece together a holistic view of campaign success or to identify which tactics are actually moving the needle.
Relying on manual reporting or siloed data sources can quickly become a bottleneck. Pulling spreadsheets from different platforms, normalizing formats, and reconciling metrics is time-consuming and error-prone. Worse, static reports often lag behind fast-moving campaigns, meaning teams spot issues or opportunities after it’s too late to act. Siloed data hinders collaboration, and marketers end up making decisions based on incomplete or outdated information.
That’s where AI-powered dashboards and automated marketing analytics change the game. By unifying data from every source and automatically surfacing trends or anomalies, these tools empower marketers to move from reactive reporting to proactive strategy. AI data visualization platforms, like TapClicks, deliver real-time, actionable insights—eliminating manual drudgery and enabling teams to focus on optimization, not just reporting. With AI-driven visualizations and automated summaries, marketing teams can see the big picture, drill into granular details, and communicate results with clarity to stakeholders.
To see how these capabilities work in practice, explore the TapClicks AI Data Visualization Tool Overview, and discover how leading teams are turning marketing complexity into competitive advantage.
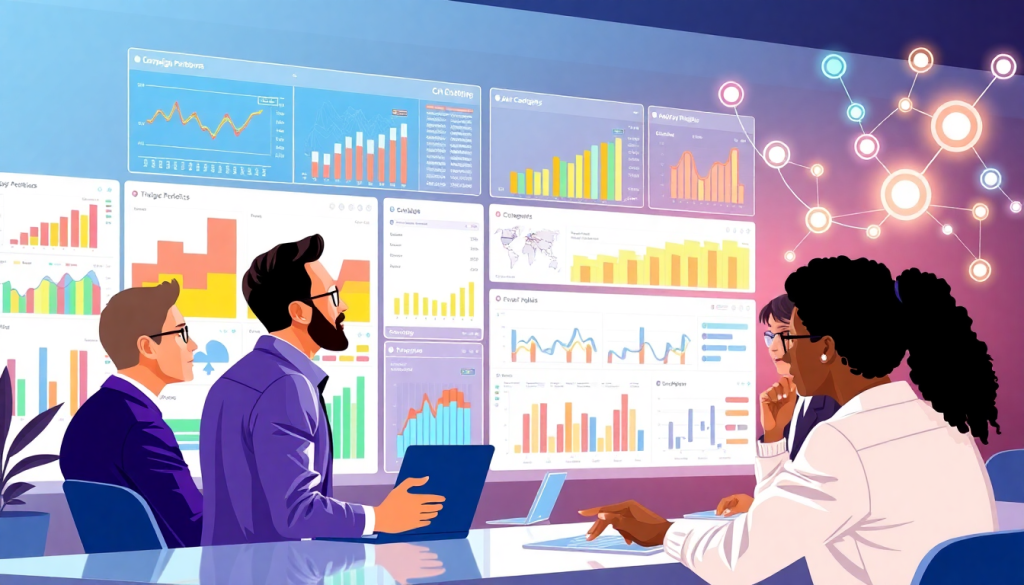
TapClicks: The Platform That Brings Marketing Data to Life
TapClicks goes beyond being just another analytics tool. It’s a unified marketing intelligence platform—built for the real-world demands of today’s marketing operations, whether you’re an agency, a multi-location brand, or an enterprise team.
Why TapClicks Is Different
Instead of wrestling with fragmented tools or manual processes, TapClicks empowers you to:
-
Visualize the Big Picture
- Connect instantly to 10,000+ marketing, advertising, and business data sources
- Combine paid, owned, and earned media metrics into a single, coherent view
- Track KPIs across every campaign, channel, region, or client
-
Tell Data Stories That Get Results
- Use drag-and-drop dashboards and a customizable reporting studio
- Build branded, client-ready reports in minutes
- Share insights with stakeholders or hundreds of clients—effortlessly
-
Act in Real Time
- Leverage AI-powered dashboards to spotlight trends, risks, and new opportunities
- Get automated recommendations for campaign optimization and budget allocation
- Benchmark performance, and pivot strategy based on real, actionable insights
What Makes TapClicks Essential for High-Volume Marketers?
| Challenge | How TapClicks Solves It |
|---|---|
| Managing hundreds of clients/campaigns | Scales easily—supporting thousands of dashboards and reports |
| Siloed data and manual reporting | Automates data pulls and report generation; unifies all channels |
| Collaboration across teams and clients | Offers robust role-based access and workflow management |
| Need for actionable intelligence | Transforms data into insights with AI-driven analysis |
The TapClicks Advantage: AI + Scale
-
For Agencies:
Automate reporting for hundreds of clients, unify multi-channel data, and save 50+ hours per analyst every month. -
For Brands & Enterprises:
Gain a consolidated view of all locations, business units, and campaigns—plus predictive analytics and budget pacing. -
For Everyone:
Use TapClicks as your single source of truth, or pipe cleaned data into your BI stack (Tableau, Power BI, Looker, etc.).
Ready to see how TapClicks’ AI transforms raw data into actionable insights?
Discover how TapClicks AI works for marketers.
No more bottlenecks. No more silos. Just marketing intelligence at scale.
Key Features of TapClicks AI Data Visualization
TapClicks redefines how marketing teams interact with their data by delivering a suite of AI-driven features designed to make sense of complex, multi-channel marketing efforts. At the heart of the platform are AI-powered dashboards that automatically aggregate, blend, and visualize campaign performance across all your marketing channels. Instead of sifting through spreadsheets or juggling siloed analytics portals, marketers get a unified, real-time view of metrics such as impressions, conversions, cost-per-acquisition, and more—updated automatically as new data flows in.
One of the standout capabilities is automated insight generation. TapClicks’ AI analyzes your dashboards and datasets in the background, surfacing trends, anomalies, and optimization opportunities without requiring manual deep dives. With features like SmartEmail, these insights can even be delivered directly to your inbox or shared with stakeholders, ensuring your team is always up-to-date on what’s working and where to focus next.
The platform’s interactive data storytelling tools further empower marketing teams to transform raw numbers into compelling narratives. With drag-and-drop widgets, customizable visualizations, and the ability to drill down into granular details, TapClicks makes it easy to create reports that not only inform but persuade—whether you’re presenting to clients, executives, or internal teams. This interactivity fosters deeper understanding and supports faster, more confident decision-making.
Moreover, TapClicks excels at cross-channel performance tracking. Whether you're running campaigns on Google Ads, Facebook, email, or dozens of other platforms, TapClicks seamlessly unifies these data streams, enabling marketers to compare, benchmark, and optimize across all touchpoints. This holistic, automated marketing analytics approach eliminates blind spots and ensures you’re always seeing the full picture.
Together, these features make TapClicks a powerful AI data visualization tool for marketing teams, offering clarity, speed, and actionable intelligence at the scale modern marketers demand. For a deeper look at the platform’s AI capabilities, check out this overview of how TapClicks AI works for marketers.
How Automated Insight Generation Works
TapClicks transforms marketing analytics by putting AI-driven insight generation at the heart of its platform. Rather than requiring teams to manually sift through dashboards and spreadsheets, TapClicks’ AI analytics engine continuously scans campaign data, looking for trends, anomalies, and optimization opportunities across all connected channels. This automated approach empowers marketers to move from reactive reporting to proactive strategy.
At the core, TapClicks leverages machine learning models to analyze key performance indicators (KPIs) in real time. These predictive models don't just report what happened—they help forecast future outcomes, benchmark performance, and recommend optimizations. For example, TapClicks' SmartPilot analyzes campaign pacing and spend, then offers recommendations to maximize ROI or reallocate budgets where they’ll have the greatest impact.
Automated insight generation also means that critical campaign performance insights are surfaced without any manual intervention. TapClicks’ AI Agents scan dashboards for outliers or sudden shifts and immediately alert users to noteworthy changes—so teams never miss a spike in engagement or a dip in conversions. Marketers receive these insights directly within the TapClicks platform, and can also enable SmartEmail, which delivers curated, plain-language summaries to stakeholders’ inboxes on a scheduled basis.
This hands-off approach to data storytelling is especially powerful when combined with TapClicks’ automated KPI reporting dashboard. Here, AI summarizes multi-channel performance into concise, actionable narratives tailored for both internal teams and external clients. Whether you’re managing a handful of campaigns or reporting at enterprise scale, TapClicks’ automated insight generation ensures your team always has the information needed to optimize performance and demonstrate marketing impact—without the manual data crunching.
Streamlined Reporting: From Data to Interactive Storytelling
TapClicks revolutionizes the reporting process for marketing teams by making it both effortless and impactful. At the core is TapClicks’ intuitive drag-and-drop dashboard builder, allowing users to seamlessly assemble and customize dynamic, visually engaging dashboards—no coding required. The branded report studio further elevates client communication, enabling agencies and in-house teams to tailor presentations with logos, color palettes, and messaging that align perfectly with their brand identity.
Creating interactive data reports begins with selecting the relevant marketing data sources—whether from paid search, social, display, or traditional channels—using TapClicks’ vast library of connectors. From there, users can drag widgets, charts, and tables directly onto the dashboard canvas, instantly visualizing KPIs, trends, and campaign performance across all channels. These dashboards aren’t just static snapshots; viewers can filter, sort, and drill down into metrics, transforming passive reports into engaging, two-way conversations about results and strategy.
Transparency and timeliness are built in. TapClicks empowers marketing teams to automate the delivery of both scheduled and real-time marketing metrics, ensuring that stakeholders—whether internal decision-makers or valued clients—always have access to the latest insights. Reports can be scheduled to arrive in inboxes at set intervals, or generated on-demand with up-to-the-minute data, reducing manual reporting burdens and fostering a culture of data-driven decision-making.
By streamlining the transition from raw data to interactive storytelling, TapClicks enables marketing teams to not only demonstrate ROI but also guide clients and stakeholders through complex performance narratives—quickly, clearly, and with total confidence. To learn more about how TapClicks can transform your reporting process, visit TapClicks.
Real-World Use Cases: TapClicks in Action
The true value of TapClicks’ AI data visualization platform comes to life when applied to real-world marketing scenarios—where speed, clarity, and actionable insights make all the difference. Whether you’re an agency juggling hundreds of client campaigns, a brand optimizing spend across dozens of channels, or an enterprise team striving for unified, executive-ready analytics, TapClicks is designed to meet your needs at scale.
Multi-Channel Campaign Visualization:
A digital agency managing campaigns across Google Ads, Facebook, programmatic platforms, and local media used to spend hours consolidating reports from each source. With TapClicks, they now leverage cross-channel dashboards that automatically blend all campaign data into a single, interactive view. This enables their strategists to spot underperforming channels, adjust creative allocations in real-time, and demonstrate ROI to clients with compelling visualizations—all without manual data wrangling. For a deeper dive into how TapClicks simplifies this process, see the AI Data Visualization Tool Overview.
Cross-Client Reporting for Agencies:
For agencies serving dozens or even hundreds of clients, TapClicks’ automated reporting and scalable dashboard templates are game-changers. One marketing analytics firm cut analyst workload by over 50 hours per month by automating scheduled KPI dashboards for each client. This freed up valuable time to focus on strategy and campaign optimization, rather than manual Excel work. With branded, interactive reports sent directly to clients, the agency delivers transparency and builds stronger relationships—while ensuring every client’s key metrics are always at their fingertips. Explore how TapClicks AI enables this efficiency in the automated KPI reporting dashboard guide.
Budget Optimization for Enterprise Teams:
A multi-location retail brand needed to manage digital ad budgets across regions, channels, and business units. TapClicks’ AI-powered insights and predictive pacing tools allowed the marketing team to proactively identify budget shortfalls, overspend, or pacing issues—often before they impacted campaigns. By visualizing spend and performance side-by-side and receiving automated recommendations, the team could quickly reallocate funds for maximum impact, boosting ROI while maintaining overall budget discipline.
In every scenario, TapClicks transforms complex marketing data into interactive stories and actionable insights, empowering teams to move faster and make smarter decisions. Curious how TapClicks’ AI-driven platform can streamline your own reporting and campaign management? Explore more real-world applications and tips on the TapClicks blog.
Integrating TapClicks with Your Marketing Stack
TapClicks is built for flexibility—it fits easily into any marketing technology ecosystem, whether you’re juggling just a few core platforms or managing data from hundreds of sources. Let’s explore how TapClicks connects, consolidates, and enhances your marketing stack without disrupting your existing workflows.
Effortless Connections: 10,000+ Data Sources
With TapClicks, your data silos become a thing of the past. Here’s how:
- Vast Integrations: Instantly connect to 10,000+ marketing, advertising, and business data sources—think Google Ads, Facebook, programmatic DSPs, CRMs, e-commerce platforms, and more.
- Smart Connectors: Integrate even niche or proprietary systems with ease, using TapClicks’ Smart Connectors.
- Automated ETL/ELT Pipelines: Pull, transform, and load data with minimal setup—no manual wrangling required.
Flexible Data Exports: Complement, Don’t Replace
TapClicks doesn’t force you to abandon your favorite analytics tools. Instead, it plays well with others:
| Use Case | How TapClicks Helps |
|---|---|
| Full Platform Adoption | Use TapClicks as your single source of truth |
| Coexist with BI Tools | Seamlessly export enriched data to Tableau, Power BI, Looker, and more |
| Hybrid Analytics | Combine TapClicks dashboards with external reporting tools for maximum flexibility |
Simple Onboarding, Quick Results
No need for drawn-out implementations or heavy IT resources. TapClicks makes onboarding a breeze:
- Connect Key Data Sources: Pre-built connectors make setup a matter of clicks.
- Configure Dashboards: Intuitive drag-and-drop tools mean marketers and technical users can get started fast.
- Automate Reporting: Set up scheduled reports and AI-driven insights in minutes.
- Role-Based Access: Scale easily across teams, clients, or locations with granular permissions.
Make the Most of TapClicks: Pro Tips
- Prioritize High-Impact Integrations: Start with channels that drive the most value, then scale.
- Automate Everything: Use scheduled reports and SmartEmail to keep everyone in the loop—without manual effort.
- Iterate and Refine: Update dashboards frequently as your needs evolve and new data sources come online.
- Lean on Support: TapClicks offers robust training, documentation, and a responsive customer success team to help you succeed.
Why TapClicks Stands Out
By offering true interoperability and a frictionless onboarding experience, TapClicks empowers marketing teams to extract more value from their data—regardless of their current stack. Integrate with confidence and start delivering smarter, faster insights throughout your organization.
Getting Started with TapClicks AI Visualization
Ready to accelerate your marketing analytics and leave manual reporting behind? TapClicks makes it easy for teams to get up and running with AI-powered data visualization in just a few steps:
1. Sign Up and Access the Platform
Begin by requesting a demo or starting your TapClicks onboarding. The platform is cloud-based, so there’s nothing to install—just log in and start exploring.
2. Connect Your Marketing Data
TapClicks integrates with over 10,000 marketing, advertising, and business data sources. Use the built-in connectors to securely sync your platforms—Google Ads, Facebook, programmatic, CRMs, and more. The system’s intuitive setup guides you through authentication and data mapping, ensuring all your channels are unified in one place.
3. Configure Dashboards and Reports
With your data flowing in, use the drag-and-drop dashboard builder to visualize performance metrics the way you want. Choose from a rich library of widgets and templates, or create custom views to match your team’s reporting needs. Branded reports can be set up in minutes—no more copy-pasting into spreadsheets.
4. Activate AI-Driven Insights
Turn on TapClicks’ AI features to automatically analyze your dashboards and datasets. The platform will surface actionable insights, send automated summaries to your inbox, and recommend optimizations based on predictive models—helping you spot opportunities and risks faster than ever.
Next Steps for Your Marketing Team
If you’re still relying on spreadsheets or disconnected reporting tools, TapClicks offers a clear path to modern marketing intelligence. Start by connecting your most critical data sources, build your first interactive dashboard, and let the AI surface insights you might otherwise miss.
Curious how TapClicks can transform your team’s workflow? Request a personalized demo or reach out to learn more about how the platform can fit your unique needs. Empower your marketing team to visualize, analyze, and act with confidence—no manual wrangling required.
Start Automating Your Marketing Data Today!
No Credit Card Required.

